
Historia in Spanish has different meanings and can be translated to English as a story or history. What makes a personal story history? What stories are part of history? What voices and stories are not included in history? “History is written by the victors” is a common phrase used to describe how structures of powerContinue reading ““Memorias del corazón” a bilingual podcast”
Category Archives: Digital Scholarship & Publishing
Rampage Party Press / in the works!

Hi! My name is Margaret Yapp – I’m currently an MFA candidate at the Center for the book, entering my thesis year. Before starting at UICB, I did an MFA in poetry at the Writers’ Workshop. I have spent the last few years at UICB really focused on learning letterpress printing and figuring out howContinue reading “Rampage Party Press / in the works!”
Python for English majors

My original goal for the Digital Scholarship and Publishing Studio’s Fellowship was to learn how to code in Python, with the end goal of using machine learning in my scholarship. However, one question that’s emerged during the summer is: how do you teach humanities majors to code? At first, I was asking this in moreContinue reading “Python for English majors”
Decades on and still standing: a history of trees on campus
uI like to press my ear against their rugged surface, run my fingers down the ridges of the bark. I close my eyes and breath in the scent of resins, of wet earth. Trees are special for me: they give me peace. That’s why I decided to make a documentary about the most significant treesContinue reading “Decades on and still standing: a history of trees on campus”
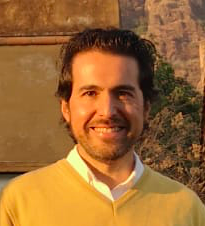
Introductory blog post: Connie Chen
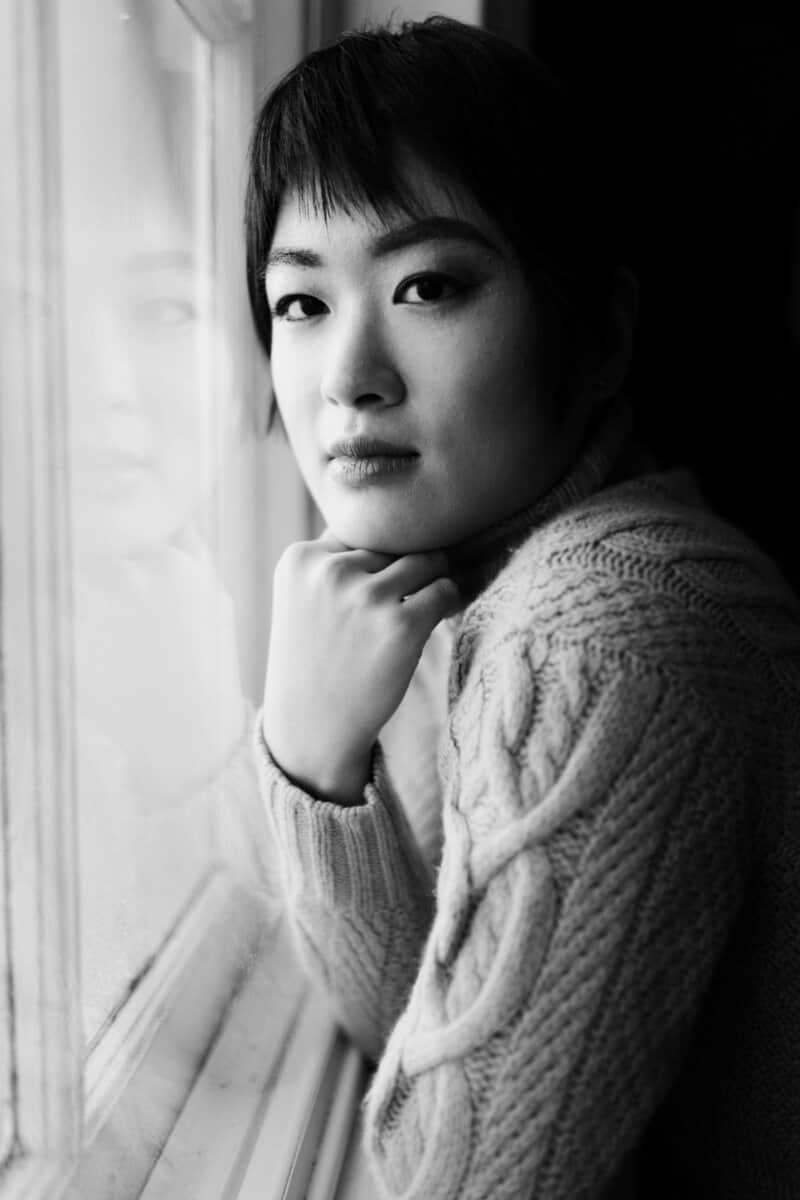
Hi! My name is Connie Chen. I am an upcoming 3rd year MFA student in the Nonfiction Writing Program. My thesis in creative nonfiction is my book project titled This is a Zoo, a polyphonic liturgy with candid appreciation of unruly flesh, and penetrating analysis of chronic illness, gender, identity, and their roots in artContinue reading “Introductory blog post: Connie Chen”
UI Libraries Digital Scholarship & Publishing Studio builds first-ever digital and searchable map of Principia Mathematica through multi-institutional, NEH-awarded grant
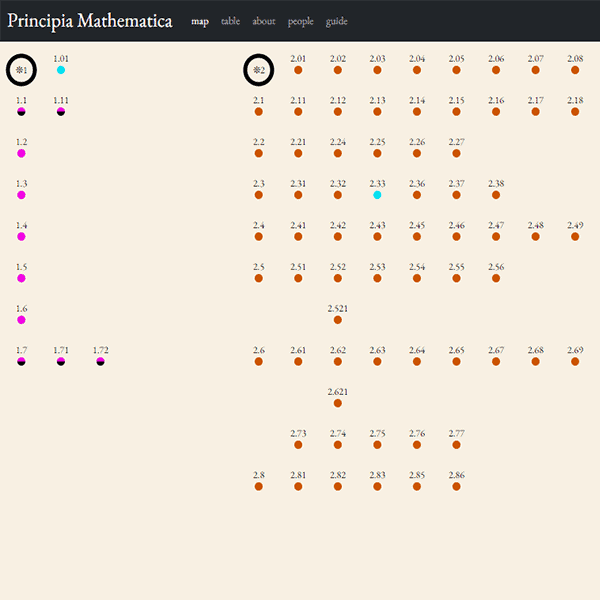
With a $281,104 Scholarly Editions and Translations grant from the National Endowment for the Humanities (NEH), researchers at the University of Iowa and Western Kentucky University collaborated to build the first-ever digital map and data table for all three volumes and 1,992 pages of Principia Mathematica—a monumental work in the philosophies of mathematics and logic.Continue reading “UI Libraries Digital Scholarship & Publishing Studio builds first-ever digital and searchable map of Principia Mathematica through multi-institutional, NEH-awarded grant”
Introducing the Studio’s 2024 Summer Fellows
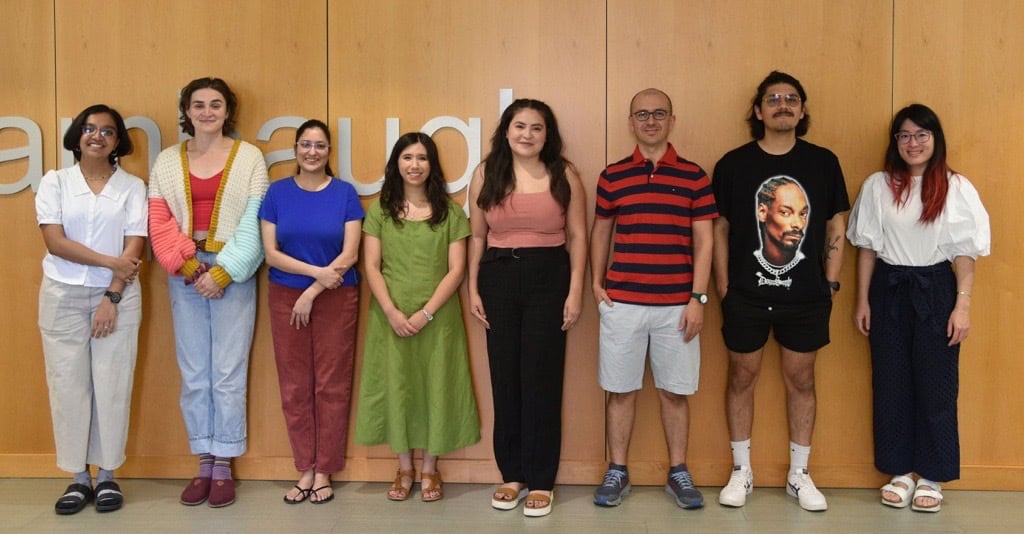
The University of Iowa Graduate College and the UI Libraries Digital Scholarship & Publishing Studio are excited to announce that 10 graduate students have been selected for the 2024 Studio Summer Fellowship program. These individuals will soon take part in an eight week course that provides mentored digital scholarship experience, as well as trainingContinue reading “Introducing the Studio’s 2024 Summer Fellows”
The Literary Heritage of Cornell College: Creating Digital Resources to Support Our Community
By Miranda Donnellan Archives are not infallible. As a librarian, this is a fact of life. But as a digital humanist, I am empowered to solve this problem. For my Public Digital Humanities Certificate capstone, under the guidance of Cornell College’s Professor Kirilka Stavreva, I created a digital archive highlighting the works of Jewel BothwellContinue reading “The Literary Heritage of Cornell College: Creating Digital Resources to Support Our Community”
The Literary Heritage of Cornell College: Using Digital Resources to Preserve the Past by Miranda Donnellan
Archives are not infallible. Paper disintegrates, photos acidify, and even metal rusts and ages. Every librarian and archivist knows that preservation relies on prevention far more than restoration, but there is only so much control you can exert over nature’s most significant force: time. As a joint Library Science and Digital Humanities student, I amContinue reading “The Literary Heritage of Cornell College: Using Digital Resources to Preserve the Past by Miranda Donnellan”
Studio Summer Fellowship applications are open for submission!
Applications are now being accepted through Feb 7 at 5 p.m. for the Digital Scholarship & Publishing Studio’s 2024 Summer Fellowship Program. The program is open to all UI PhD, MFA, and DMA students looking to benefit from an in-person, mentored digital scholarship experience this upcoming summer. Learn more about the program and apply onContinue reading “Studio Summer Fellowship applications are open for submission!”