
The University of Iowa Graduate College and UI Libraries Digital Scholarship & Publishing Studio have selected eight graduate students for the 2026 Digital Scholarship & Publishing Summer Fellowship Program. The eight-week program, which runs June 15 through Aug. 6, provides mentored digital scholarship development through coursework and hands-on application, along with training in tools and techniques to supportContinue reading “Introducing the 2026 Digital Scholarship & Publishing Summer Fellows “
Category Archives: Digital Scholarship & Publishing
UI Libraries, history professor launch interactive public digital humanities website
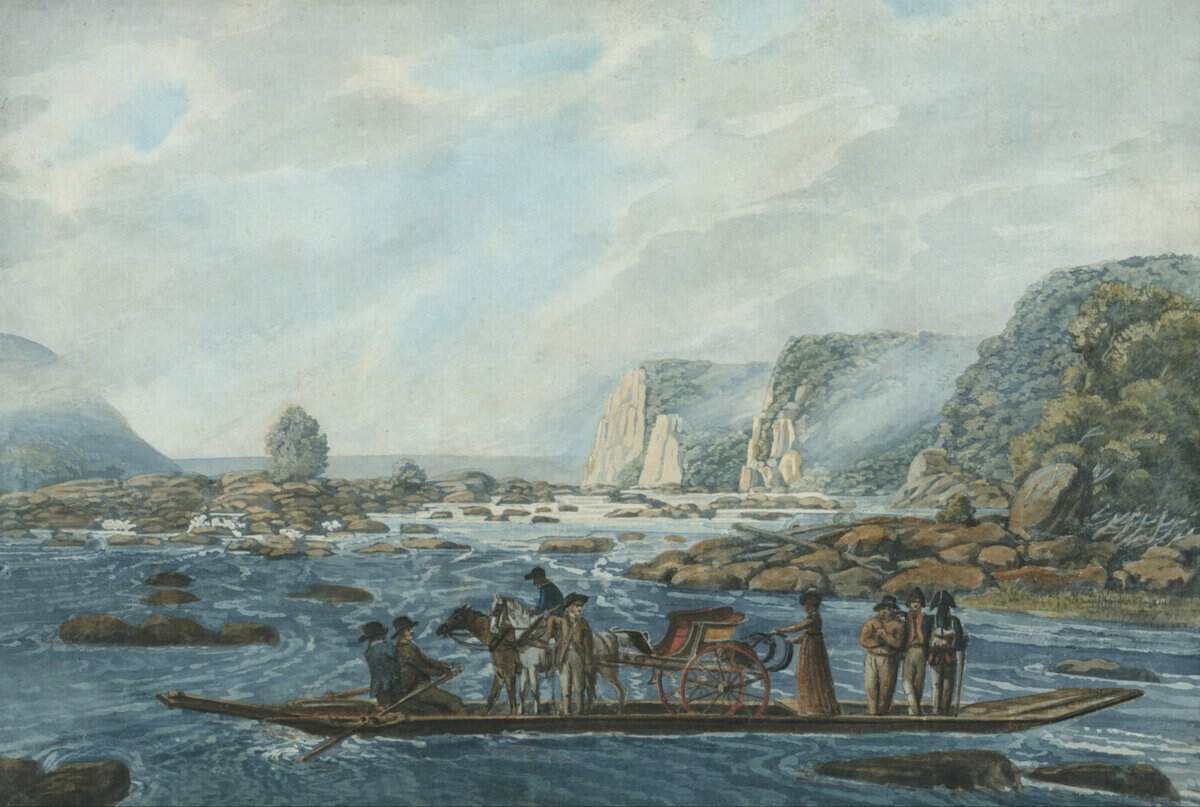
A collaborative digital humanities project supported by the University of Iowa Libraries has launched. A Just and True Return (JTR) is led by Cory Young, assistant professor in the UI Department of History. Developed with technical support from the Libraries’ Digital Scholarship and Publishing Studio (DSPS), JTR is a publicly accessible database of Pennsylvania’s survivingContinue reading “UI Libraries, history professor launch interactive public digital humanities website”
Iowa, Maryland law schools launch Genetic Privacy Map
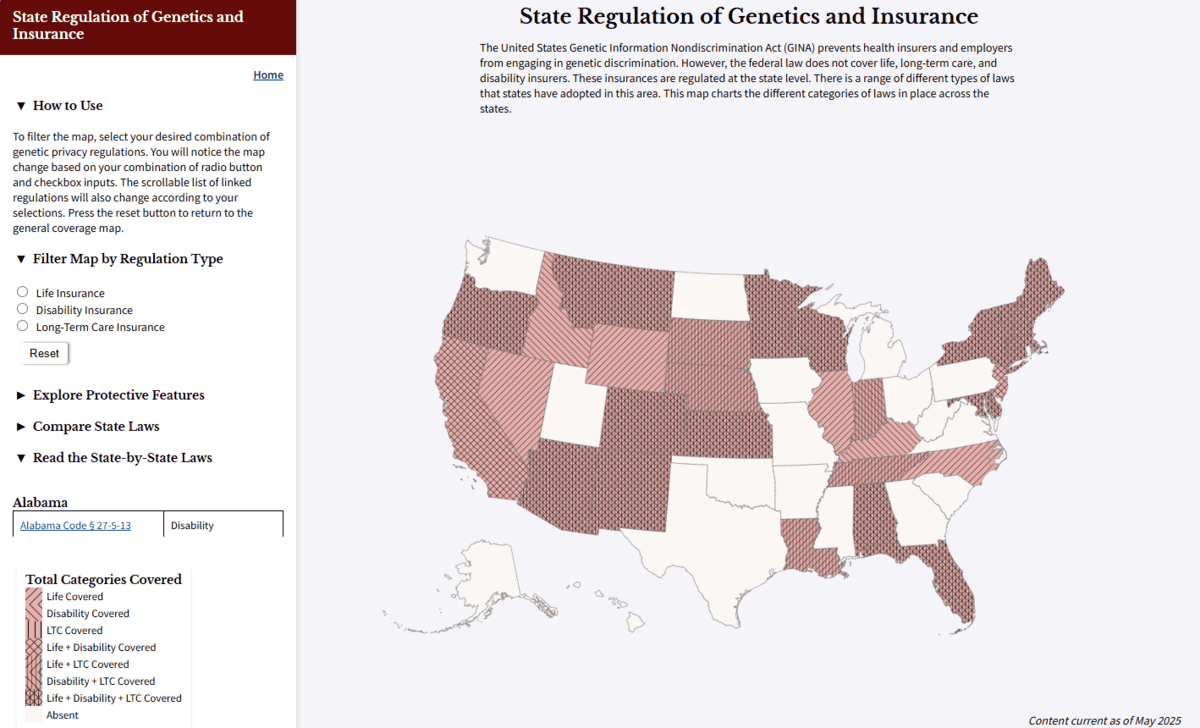
The University of Iowa Libraries Digital Scholarship & Publishing Studio is excited to announce the launch of Genetic Privacy in the U.S.: Insurance and Law Enforcement Use, a collaborative digital project developed with the University of Iowa College of Law and the University of Maryland Francis King Carey School of Law. This project builds onContinue reading “Iowa, Maryland law schools launch Genetic Privacy Map”
Introducing the 2025 Digital Scholarship & Publishing Summer Fellows
The University of Iowa Graduate College and UI Libraries Digital Scholarship & Publishing Studio are excited to announce the 11 graduate students selected for the 2025 Digital Scholarship & Publishing Summer Fellowship Program. These individuals will soon take part in an eight-week learning experience that provides mentored digital scholarship development through course work and hands-onContinue reading “Introducing the 2025 Digital Scholarship & Publishing Summer Fellows”
In collaboration with the Iowa Women’s Archive, Our Rightful Place is now open to explore
We are pleased to announce the launch of Our Rightful Place in collaboration with the University of Iowa Libraries Iowa Women’s Archives. This digital collection of oral history interviews, data visualizations, archival stories, and more celebrates the history of women in Iowa politics. This project originally grew from the work of 50-50 in 2020, a nonpartisanContinue reading “In collaboration with the Iowa Women’s Archive, Our Rightful Place is now open to explore”
Summer fellow Margaret Yapp’s final presentation script

Intro This summer I began work on a publishing project called Rampage Party Press, which I’ll spend the next year developing as my thesis project to complete an MFA in Book Arts. Before this program, I received an MFA from the Iowa Writers’ Workshop, where I studied poetry. In so many ways, Rampage Party PressContinue reading “Summer fellow Margaret Yapp’s final presentation script”
Summer fellow Connie Chen’s final presentation
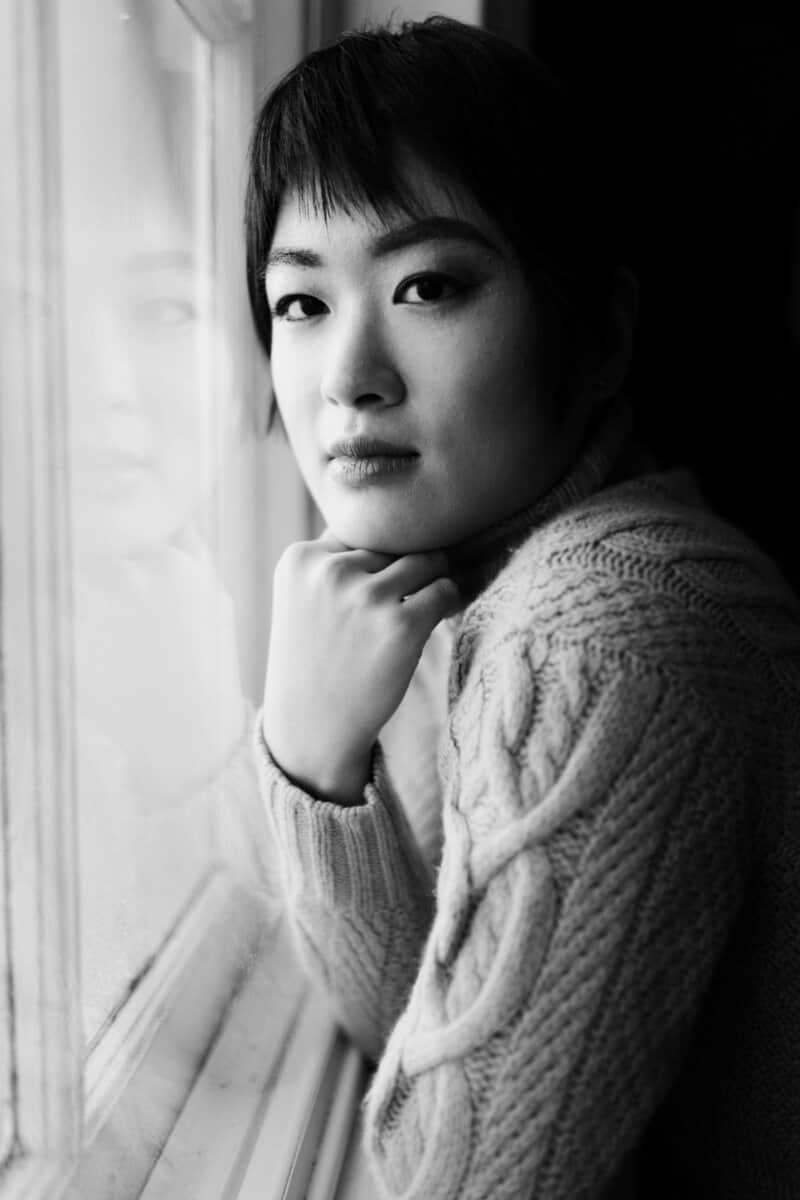
Connie Chen’s final presentation and findings from the summer, Tampons of Tauromachy can be found on video here.
Audio recordings from summer fellow María G. Marroquín Perez

The following are audio recordings in both Spanish and English produced by María G. Marroquín Perez: Recording in Spanish: Recording in English:
Summer fellow Aileen Tierney’s final presentation script

Hi, good afternoon! My name is Aileen Tierney and I’m an English PhD student going into my third year at the University of Iowa. As a Digital Studio Summer Fellow, I spent my summer learning how to code in Python in addition to reading relevant subjects in my field of study (contemporary literature) such asContinue reading “Summer fellow Aileen Tierney’s final presentation script”
Summer fellow Alejandro Mauricio Ruiz Zepeda’s final presentation script
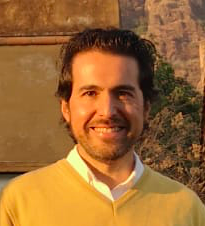
In the morning I go out to the garden and water the plants. I pick up some of the guavas that have fallen from the tree. This is my routine when I visit my parents in the winter. The guavas are yellow and pink, the size of a lime. I bring one of them toContinue reading “Summer fellow Alejandro Mauricio Ruiz Zepeda’s final presentation script”