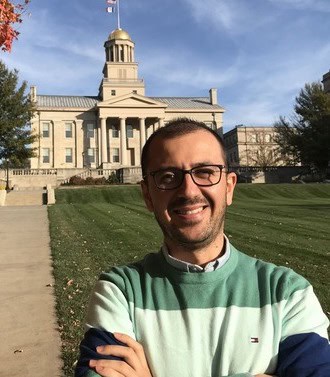
“As a PhD candidate in Religious Studies, I am interested in Late Antique Christian warrior saints or military martyrs, how they emerged and how their cults spread throughout Mediterranean. In this summer project, I aimed to create a geo-spatial map based on ancient Christian sources. To prepare the map, I started by scanning primary sourcesContinue reading “Summer fellow Hasan Degerli’s final presentation script”
Category Archives: Digital Scholarship & Publishing
Herencia means Heritage: Empowering Artisans and Fostering Community by Javier Espinosa Momox
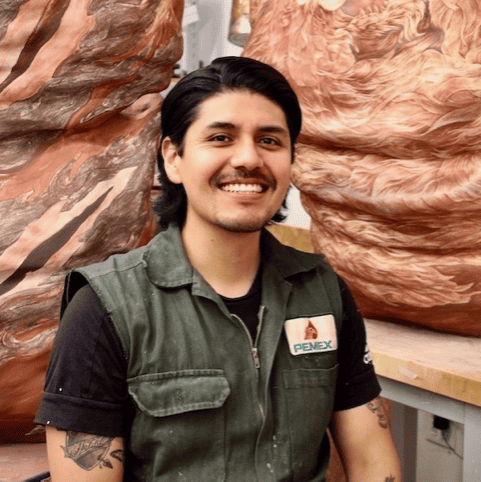
To whom does history belong: to those who live it or to those who record it? For too long, we have accepted that history is told from hegemonic academic institutions, dominated by wealthy Caucasian individuals, who say who has access to historical knowledge. As the popular saying goes, “History is written by the victors,” orContinue reading “Herencia means Heritage: Empowering Artisans and Fostering Community by Javier Espinosa Momox”
Summer fellow Mahdi Feyz Karimlou’s final presentation script
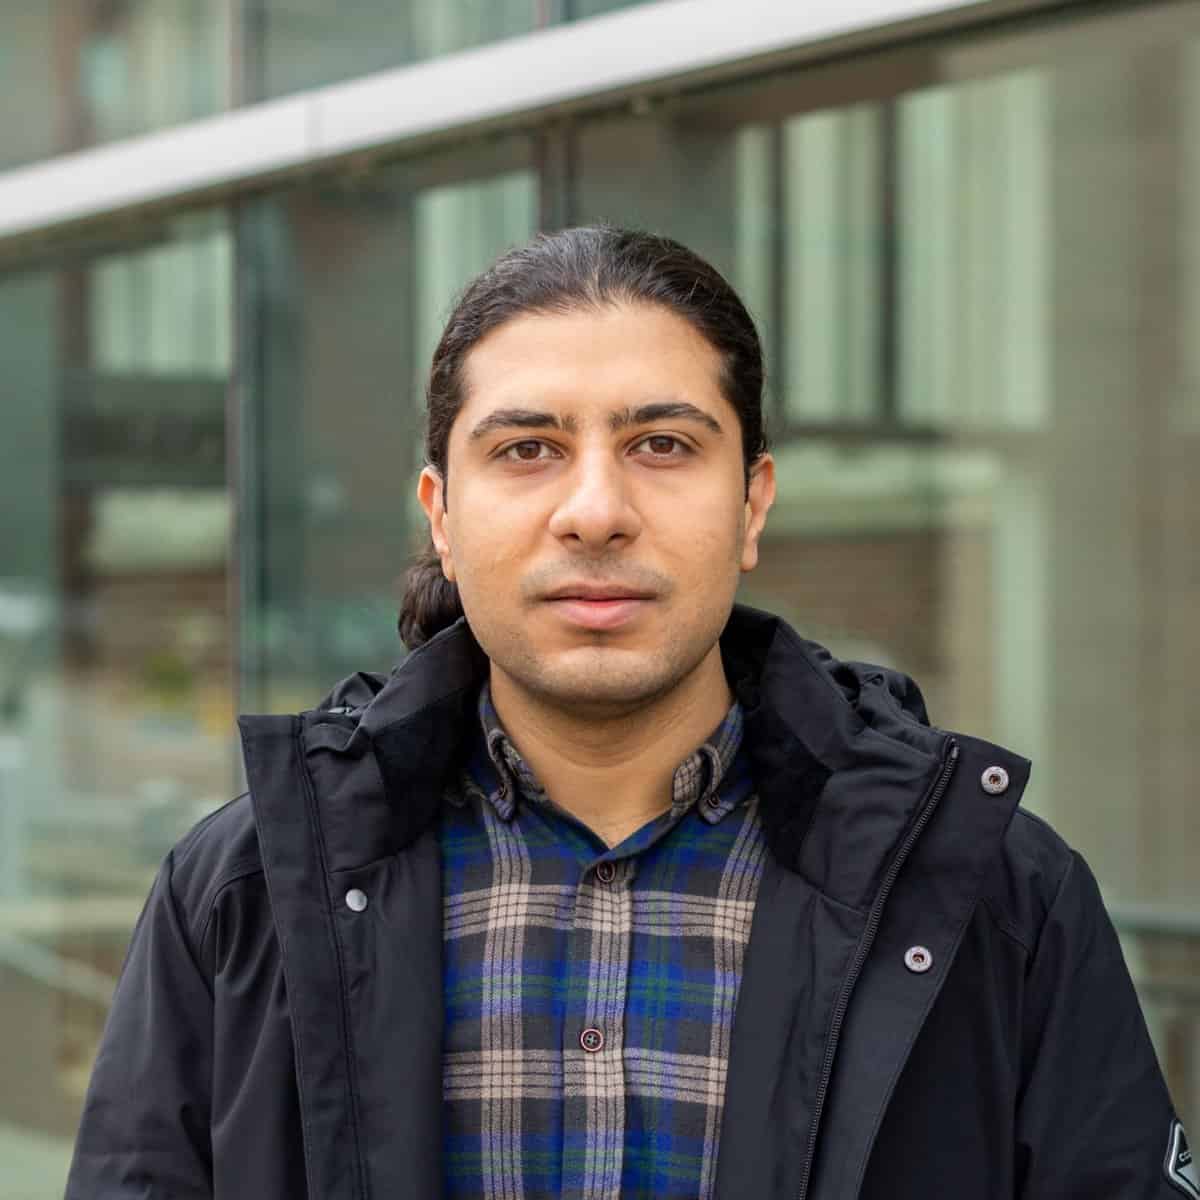
(In Farsi:) برای یک زندگی معمولی. For an ordinary life. In September 2022, when Iranians started a series of street demonstrations, everyone knew that a new social movement was taking shape. Many asked what this movement was all about; and many truly answered: abolishing a system of male-dominant gender relations. However, social movements not onlyContinue reading “Summer fellow Mahdi Feyz Karimlou’s final presentation script”
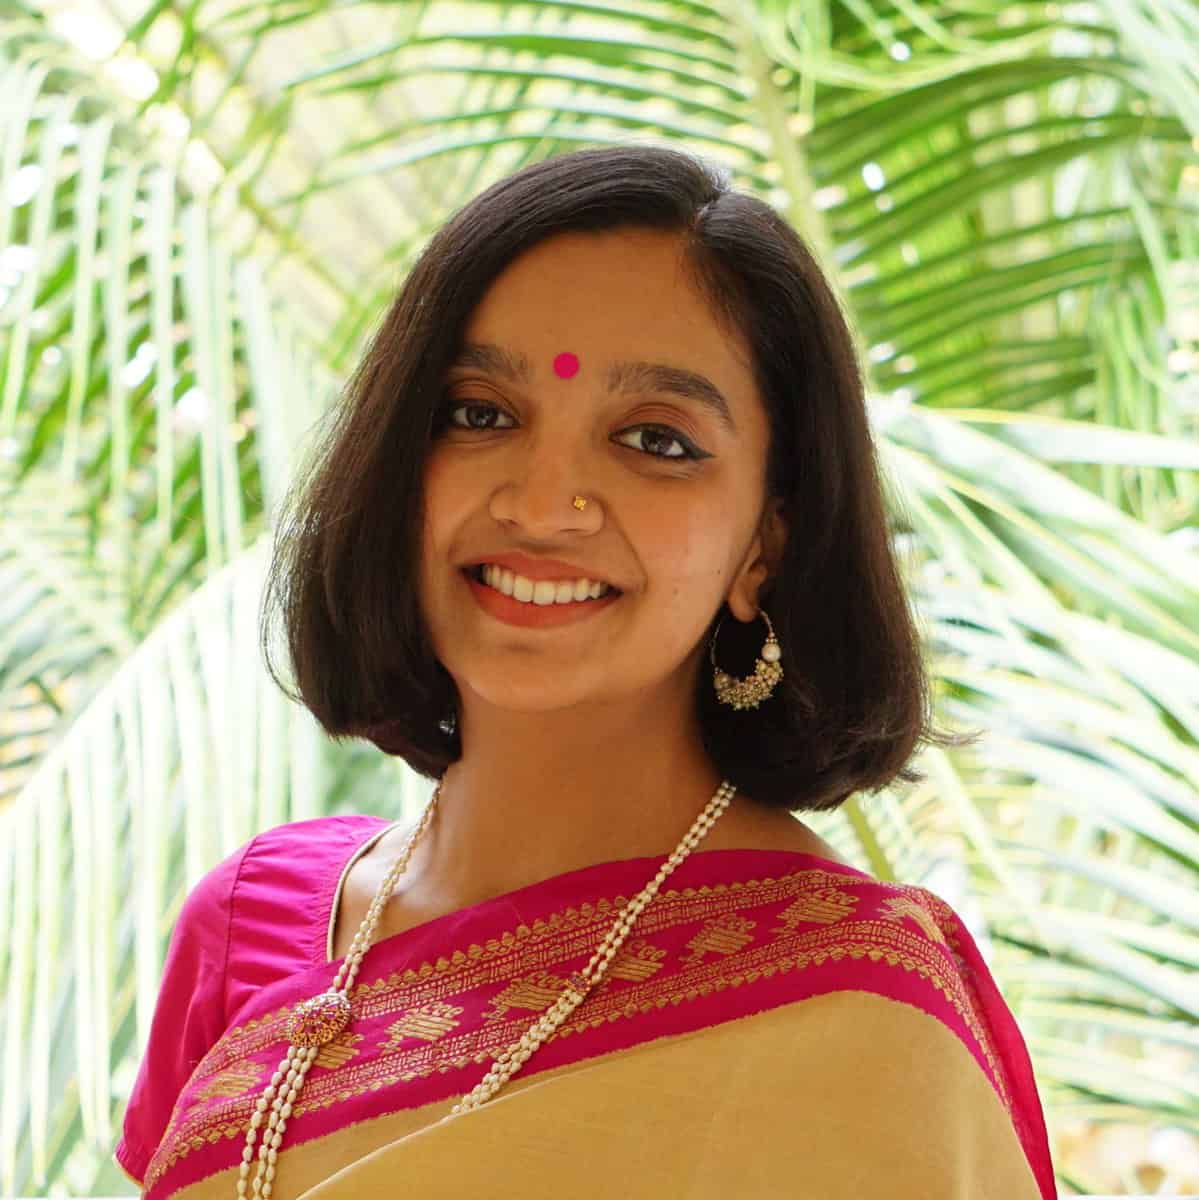
Summer fellow Falak Jalali’s final presentation script

My name is Falak Jalali. I am a PhD student in Geography. I work with farmers in Himachal Pradesh, a hilly state in northern India. Himachal Pradesh is part of the great Himalayan ranges, which span eight countries. Over the last decade, agriculture has shifted from subsistence to high-value horticulture crops, coupled with impacts ofContinue reading “Summer fellow Falak Jalali’s final presentation script”
UI Libraries Digital Scholarship & Publishing Studio launches Health Story Hub, NEH-awarded digital project collaboration

The University of Iowa Libraries Digital Scholarship & Publishing Studio (DSPS) has launched a unique digital resource for educators, students, and community members. Health Story Hub is an open access website that offers a searchable database of stories about health, illness, and healing for teachers to use in classrooms, community groups and clinics. Kristine Muñoz,Continue reading “UI Libraries Digital Scholarship & Publishing Studio launches Health Story Hub, NEH-awarded digital project collaboration”
Javier Espinosa Momox’s summer fellowship blog
I have been working on my digital archive, you can view it here. HERENCIA MEANS HERITAGE HERENCIA MEANS HERITAGE IS A DIGITAL ARCHIVE THAT SEEKS TO HELP GIVE REPRESENTATION TO MARGINALIZED AND INVISIVILIZED ARTISAN COMMUNITIES AS WELL AS INCIPIENT CRAFT PROPOSALS.MISSIONHERENCIA MEANS HERITAGE AIMS TO CELEBRATE AND PRESERVE THE RICH TRADITION OF TRADITIONAL HANDCRAFTED POTTERY THROUGH COMMUNITY-BASEDContinue reading “Javier Espinosa Momox’s summer fellowship blog”
Summer Fellowship post by Hasan Degerli
Hello, My name is Hasan Degerli, a PhD candidate in the Religious Studies Department. I’ve been exploring ideas for a project that merges my field with Digital Humanities, and the Digital Humanities summer fellowship program at the University of Iowa Library has provided the perfect opportunity to bring this vision to life. My project focusesContinue reading “Summer Fellowship post by Hasan Degerli”
Understanding agrarian change through farmer’s emotions.
Ever since I was an undergraduate student of Political Science the differences between access to basic amenities like clean drinking water, clean living spaces, health etc concerned me. I decided to work in the development sector to understand the reason better and to spend my life working in service of achieving dignity and equality forContinue reading “Understanding agrarian change through farmer’s emotions.”
Mahdi Feyz Karimlou’s post on summer project work
Iran’s political climate has experienced a series of social protests in the past few years. These episodes were caused by different issues and aimed at different ideals and demands which has given rise to the debate if they should be considered as divergent, scattered protest activities or if they all can be seen as differentContinue reading “Mahdi Feyz Karimlou’s post on summer project work”
How do artists’ books translate to a digital medium?
My project initially seemed straightforward, but I soon realized that the undertaking was much more profound than I had imagined. The question I began with was simple. What is the best way to portray an artist book online? Artists’ books are physical objects that convey meaning through structure, form and content. These books are worksContinue reading “How do artists’ books translate to a digital medium?”