The US immigration system produces a complex hierarchy of legal and visa statuses that grant different rights, freedoms, and protections to immigrants. However, distinctions in visa types are often overlooked or omitted in conversations about immigration, both in research as well as in public discourse. I believe one reason for this is the sheer complexity of the US immigration system – an alphabet soup of visa statuses and ever-changing laws and policies. Another reason why visa status is understudied is the lack of data – surveys often do not ask about visa status and government records available are sparse, making it difficult, for example, to distinguish between types of visa holders and to know the number of unique individuals living in the US with a given visa type.
This summer, I will use my time as a Digital Studio fellow to compile data from multiple government sources about the types of visas available, the restrictions attached to each, and trends and patterns in visas issued. I am hoping to use the data I compile to ask basic questions like: What kinds of visas are issued? To people from which countries are these visas issued to? How do these patterns change over time? In the past couple of weeks, I have explored some of these questions using data from the Visa Office Annual Reports (2000-2019), published by the Bureau of Consular Affairs in the US Department of State.
In the context of the US immigration system, visas are broadly classified into two groups – immigrant visas and non-immigrant visas (yes, “non-immigrant visa holder” does sound like an oxymoron!). The main distinction between these two groups is that an “immigrant visa” is given to a person who intends to permanently move to the US or “immigrate”. Some examples of immigrant visas include visas given to immediate relatives and family members of US citizens (such as IR, CR, and F visas), diversity visas given through a lottery system (DV visa), and employment-based visas (E visa).
In contrast, a non-immigrant visa is given to a person who intends to move to the US temporarily for a limited time and a specific purpose, such as vacationing in the US, going to college, or working for a limited time. Non-immigrant visas come with restrictions, such as the length of time a person can stay in the US and what activities they are authorized to engage in while they are here. Two common examples of non-immigrant visas are student visas (F1) and skilled worker visas (H1B).
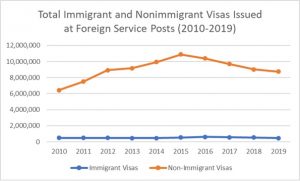
The graph below shows the trends in the total number of immigrant and non-immigrant visas issued between 2010 and 2019.

It is important to note that the number of visas issued does not reflect the number of immigrants living with visas in the US at any given time – it is possible that a person obtains a visa, but chooses not to come to the US; is issued a visa but denied entry at the border; or that the same person may apply and be issued visas multiple times in a give a year.
Despite this potential inconsistency, I think that data on visas issued is important for better understanding flows of immigration and examining the role of immigration policy in constructing the experiences and opportunities of immigrants. At the time of this writing, the uncertain plight of immigrant workers and their families is in the news again following of an executive order that suspended the entry of certain temporary workers and their families. I hope to spend the rest of the summer exploring this data and creating visualizations that help fellow researchers and the public to analyze timely and critical questions about the US immigration system.
Hansini Munasinghe
