Imprisonment rates in the U.S. increased by 700 percent between the 1970s and 2000 (Beck and Harrison 2001), and this mass incarceration has garnered substantial attention among sociologists and criminologists. Although many studies have found on correlates of mass incarceration such as the growth of economic and racial/ethnic minority groups, the role of Republican leadership at national- and state-levels, and welfare retrenchment (Jacobs and Carmichael 2001, Heimer et al. 2012, Stucky et al. 2007), these studies mostly used overall imprisonment rate outcome that potentially masked important gendered patterns in the imprisonment overtime.
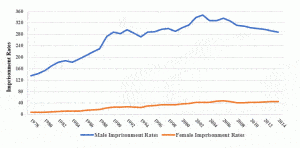
Figure 1 shows changes in imprisonment rates by gender between 1978 and 2014. Overall, imprisonment rates for both male and female expanded in the past three decades. For example, male imprisonment rates in 1978 were about 135 per 100,000 (U.S. adults). By 2003 their imprisonment rates peaked at 347/100,000. The rates slightly declined since then and reached to 288/100,000 by 2014. Similarly, female imprisonment rates in 1978 were only 8 per 100,000 U.S. adults, and the rates substantially increased by 2014 as 45 females per 100,000 were behind bars (National Prisoner Statistics, 1978-2014).
Figure 1. Changes of Imprisonment Rates (per 100,000 U.S. Adults) by Male and Female: 1978-2014
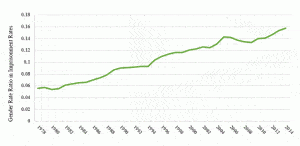
Although female imprisonment rates were much lower than that of males, Table 1 shows us that percentage changes for female imprisonment rates increased dramatically in the past three decades. Between 1978 and 2014, the increase of female imprisonments was 463 percent, while male imprisonment rates increased by 113 percent. In addition, Table 1 provided notable gendered patterns in imprisonment for specific periods. During the mass imprisonment era (the 1980s), female imprisonment rates increased at two times the male imprisonment rates. During the 1990s, female imprisonment rates were even six times greater than male imprisonment rates. Since the 2000s, while male imprisonment rates showed a slight decline, female imprisonment rates still grew. Altogether, these overtime patterns inform us of a decline in the gender gap in imprisonment rates in the past three decades because of a more substantial increase in female imprisonment rates than male imprisonment rates (see Figure 2).
Table 1. Percentage Changes of Imprisonment Rates by Male and Female for Selected Time Periods
Figure 2. Changes of Gender Rate Ratio (Female to Male) in Imprisonment Rates: 1978-2014
Collectively, the descriptive evidence poses a question for us – why is a percentage change for female imprisonment rates greater than the male? Given that previous studies have not sufficiently addressed the gendered patterns in imprisonment rates, it is still less known what factors have shaped the gendered patterns in the recent U.S. imprisonment (e.g., Heimer et al., 2012). My project for the digital fellowship thus addresses this important gender difference in imprisonment rates. To be more specific, by creating a dataset for 50 states from 1978 to 2016, I examine what macro-level factors – economic conditions, partisan politics, and welfare retrenchment — have contributed to patterns of gender in imprisonment using seemingly unrelated regression (SUR) modeling.
I am currently working on statistical analyses while updating my old data by adding the 2015 and 2016 datasets. Before my second blog posting, I anticipate finalizing my analyses and identifying key indicators for the gendered patterns in the overtime imprisonment patterns. Finally, I plan to create choropleth maps in ArcGIS that show variations of the outcome and predictor variables across state and time.
Jihye (JJ) Park
References
Beck A, Harrison P (2001) Prisoners in 2000. Bureau of Justice Statistics, Washington, DC
Bureau of Justice Statistics. National Prisoner Statistics, 1978-2014.
Heimer, K., Johnson, K., Lang, J., Rengifo, A., & Stemen, D. (2012). Race and Women’s
Imprisonment: Poverty, African American Presence, and Social Welfare, Journal of
Quantitative Criminology, 28, 219-244.
Jacobs D, Carmichael J (2001) The politics of punishment across time and space: a pooled time-series analysis of imprisonment rates. Social Forces, 80, 61–91.
Stucky T.D., Heimer K., Lang J.B. (2007) A bigger piece of the pie? State corrections spending and the politics of social order. Journal of Research in Crime and Delinquency, 44, 1–33.


