As my last post discussed, my project this summer deals with a series of monthly reports by public health nurses in 1930s Native American communities. Each report includes statistics and a narrative description of the nurse’s work. The narratives are often detailed and evocative, and sometimes represent indigenous voices—those of the handful of Native women who worked as public health nurses for the Office of Indian Affairs. However, the voices of Native patients are always filtered through the nurse’s perspective. I thought the statistical reports might offer a closer look at how patients, their families and their communities were actually responding to the federal government’s health program, and I have been working with the Studio this summer on cleaning and visualizing a large portion of that data.
For many reasons, rooted in both historical and personal experience, Native patients and families often refused treatment in hospitals and rejected public health nurses’ advice. Because of this resistance, field nurses kept track of who told them about new cases. One of the categories of reports was “By family.” This statistic is nowhere near a perfect measurement of Native families’ trust in public health nurses. For one thing, healthcare options in 1930s reservations were usually limited and health conditions dire, so reporting a problem to a field nurse could be a last resort. There’s also plenty of potential for inaccuracy and inconsistency in the numbers themselves, as I discussed in my previous post. However, these statistics do offer a different way to look at Native families’ actions and choices.
I used Excel visualizations to look at the patterns in the number and the percentage of new cases reported by families. Excel’s “slicer” feature allows me to quickly break down a chart based on a large dataset and see individual patterns. I can compare a particular nurse’s statistics with her narratives and add depth to both sources. Here’s an example:
In March of 1934, field nurse Georgia Lyle, a white woman, was transferred from the Eastern Cherokee community in North Carolina to the Fort Berthold Reservation in North Dakota. In April, she noted that people said they had been waiting for a field nurse for seven years, and that the agency had “bought and worn out two field nurse’s cars without ever having a field nurse.” The claim that the community really wanted a public health nurse matches the statistics for Lyle’s first full month on the job, when families reported 94% of new cases. However, the following months show a striking change, with smaller and smaller percentages of the new cases reported by families.
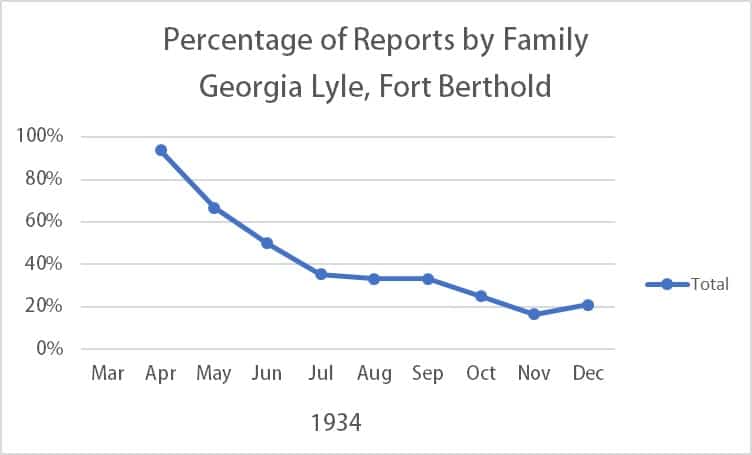
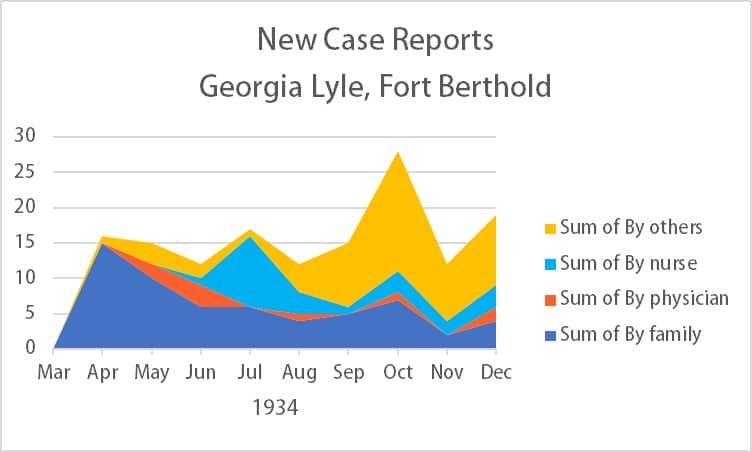
And at the same time, the actual number of new cases per month stayed fairly consistent (with an unusually large number in October. It’s not completely clear why so many more cases were reported by “others” in this month, but Lyle’s narrative mentions at least one teacher who told her about a case.)
So, what happened? Why were families less and less inclined to report new cases to Lyle after her first month of work?
In June, Lyle wrote about her feelings of inadequacy and the difficulty of truly improving public health in the face of drought and pervasive poverty. In August, she wrote, “While it has been a pleasure to work with the Indians on this reservation I do not see how a field nurse can accomplish anything without the cooperation of the Agency physician.” The physician disapproved of public health nursing (a common attitude, since many physicians saw it as a threat to their authority) and blocked Lyle from performing several of her expected tasks. Beyond that, Lyle portrayed him as someone who resented his Native patients and saw them as obstacles to his own professional advancement. She reported that he said, “I do not need a field nurse but I do want another nurse in the hospital. If I had more help and could get these Indians to let me do two hundred (200) major operations I could get to be a fellow of the American College of Surgeons.”
This kind of attitude was common. A great deal has been written both about the exploitation of indigenous patients in general, and specifically about the Office of Indian Affairs’ issues with under-qualified and even abusive personnel. Native author Zitkála-Šá wrote in 1900 that Native American boarding schools were more of a charity for indifferent and incompetent employees than for their students, and she specifically mentioned a school doctor.
So, it’s easy to understand why the Fort Berthold community might have been eager to see a new health worker and then disillusioned when the limits of her work became clear. If that’s the story behind the graph, it’s infuriating, but also illuminating. Many field nurses complained that Native patients were fatalistic about their health problems, but this combination of statistics and text shows patients’ families acting in pursuit of better health.
I hope there’s more to this story; there certainly are other interpretations of this data, and I have several more years’ worth of statistics to analyze. It’s also one of many stories I hope to draw out of the source material with the help of the digital skills I’ve learned this summer.
–Laurel Sanders