
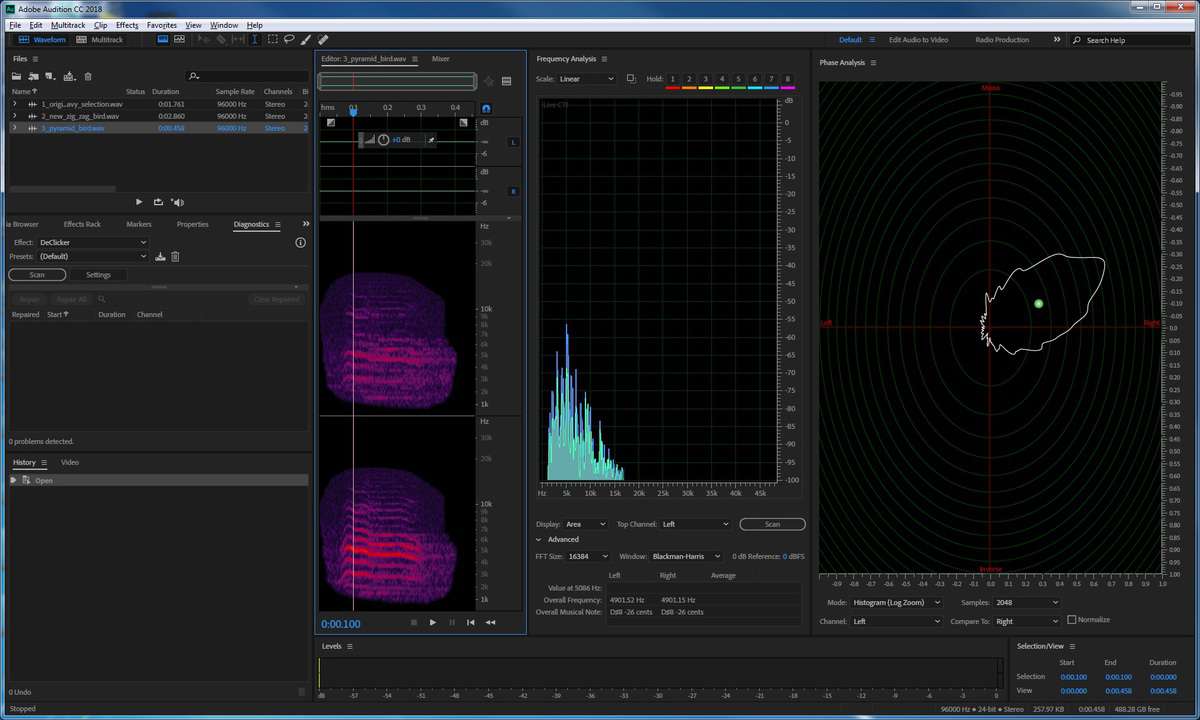
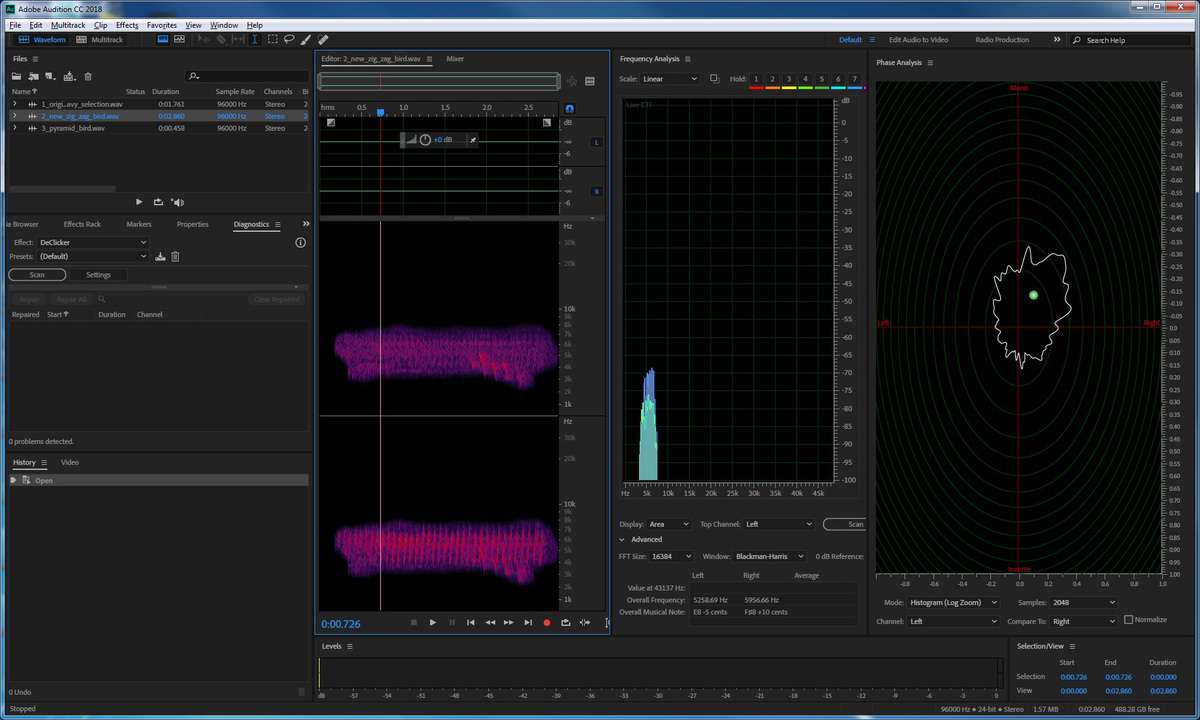
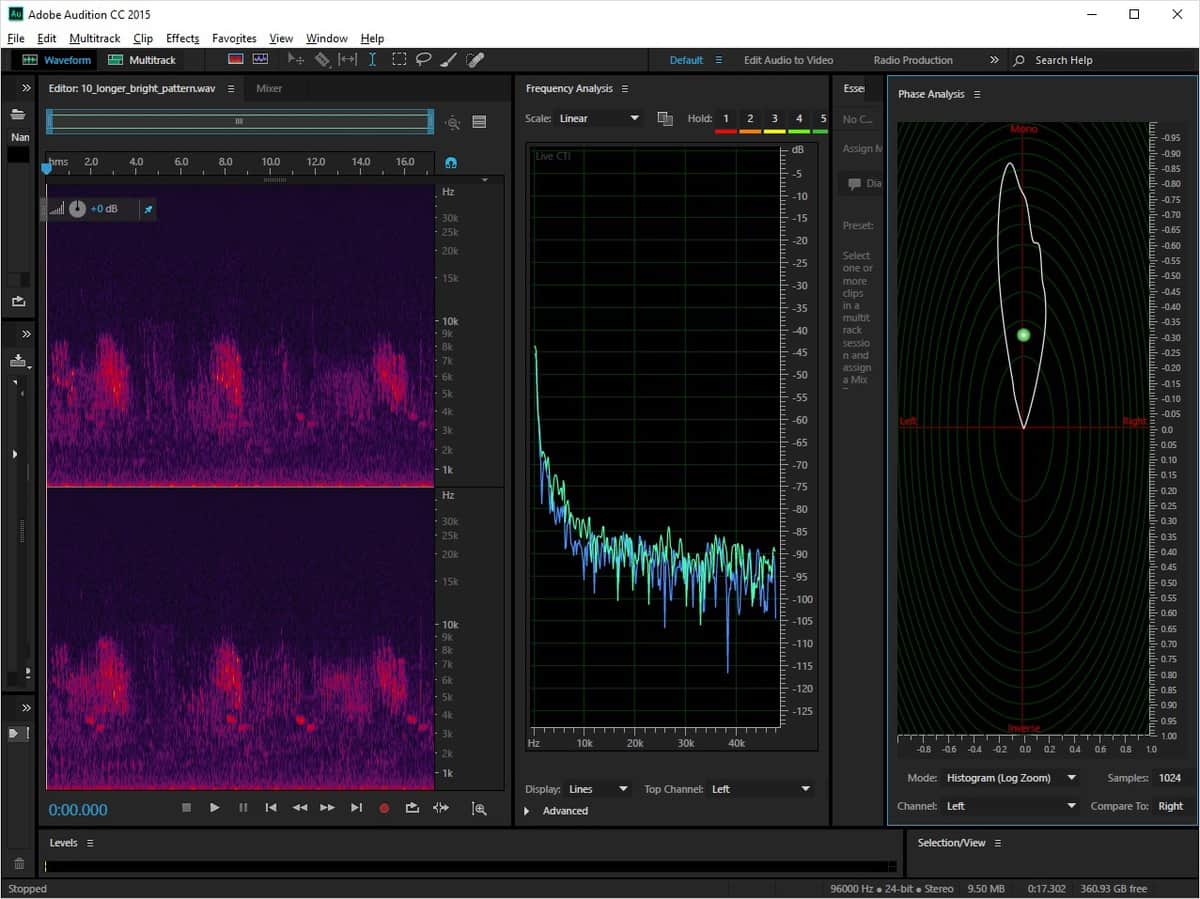
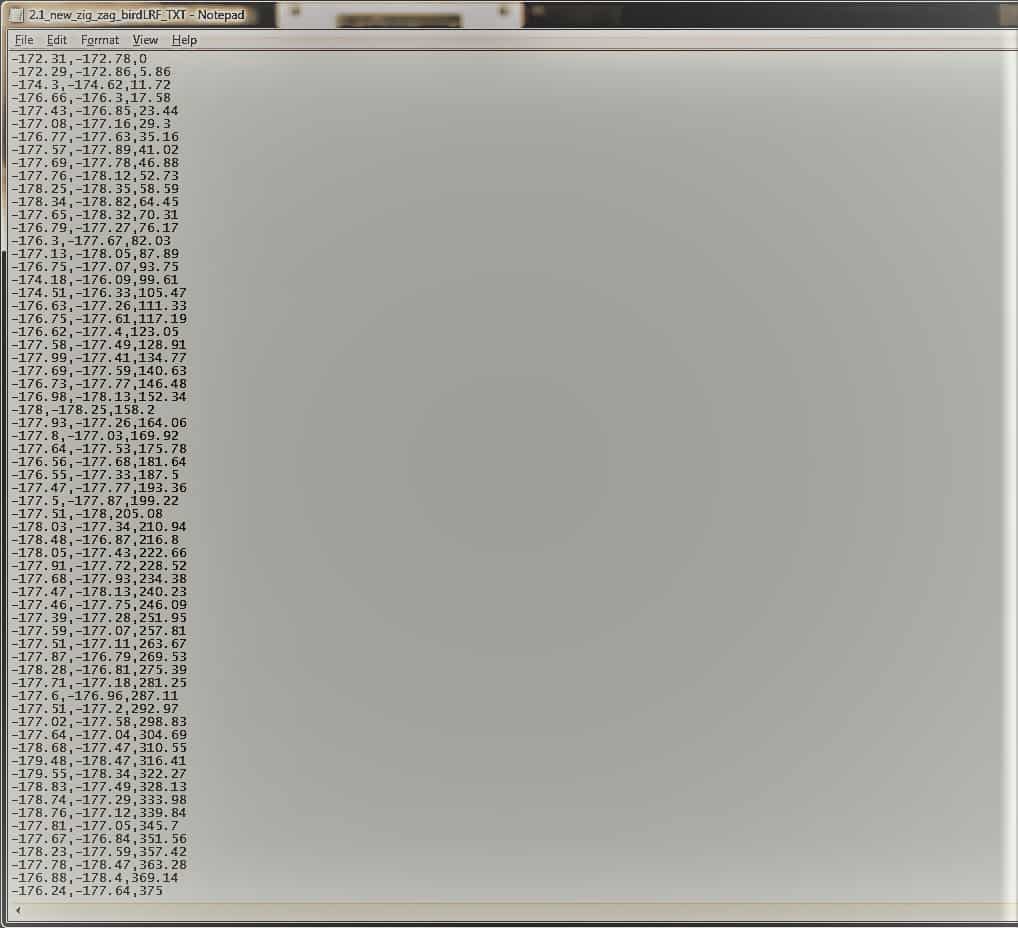
I have spent the past few weeks selecting audio samples in Audition, exporting data and thinking about visualization.
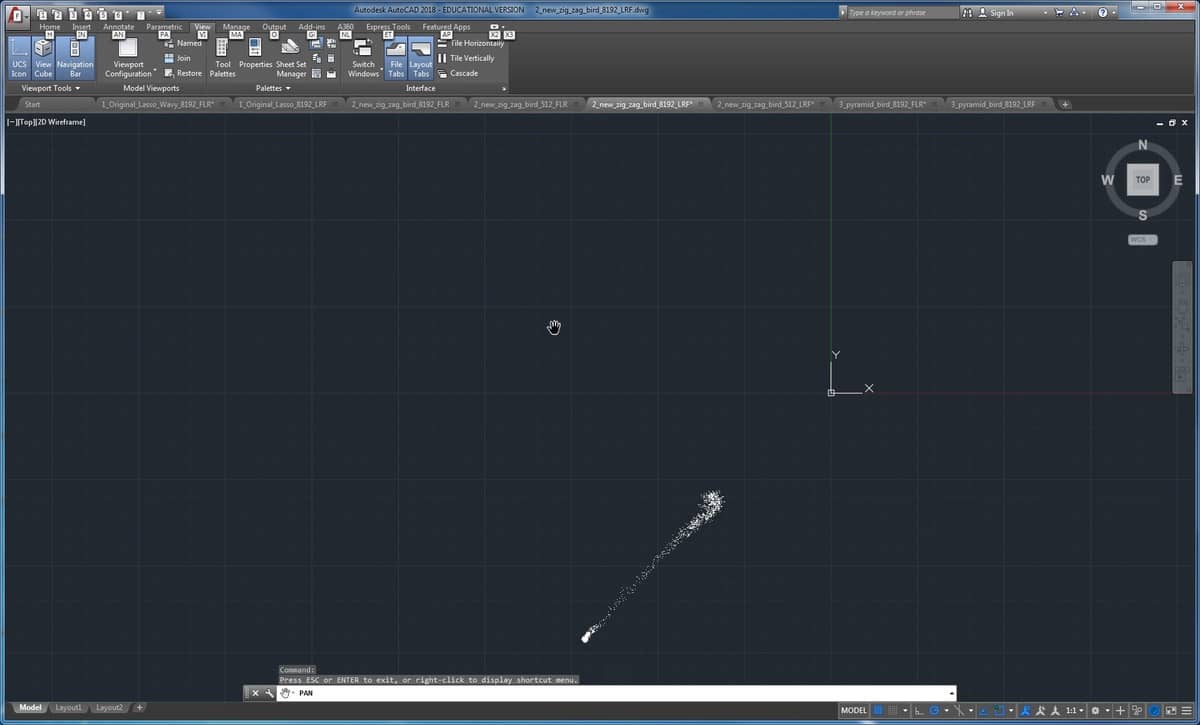
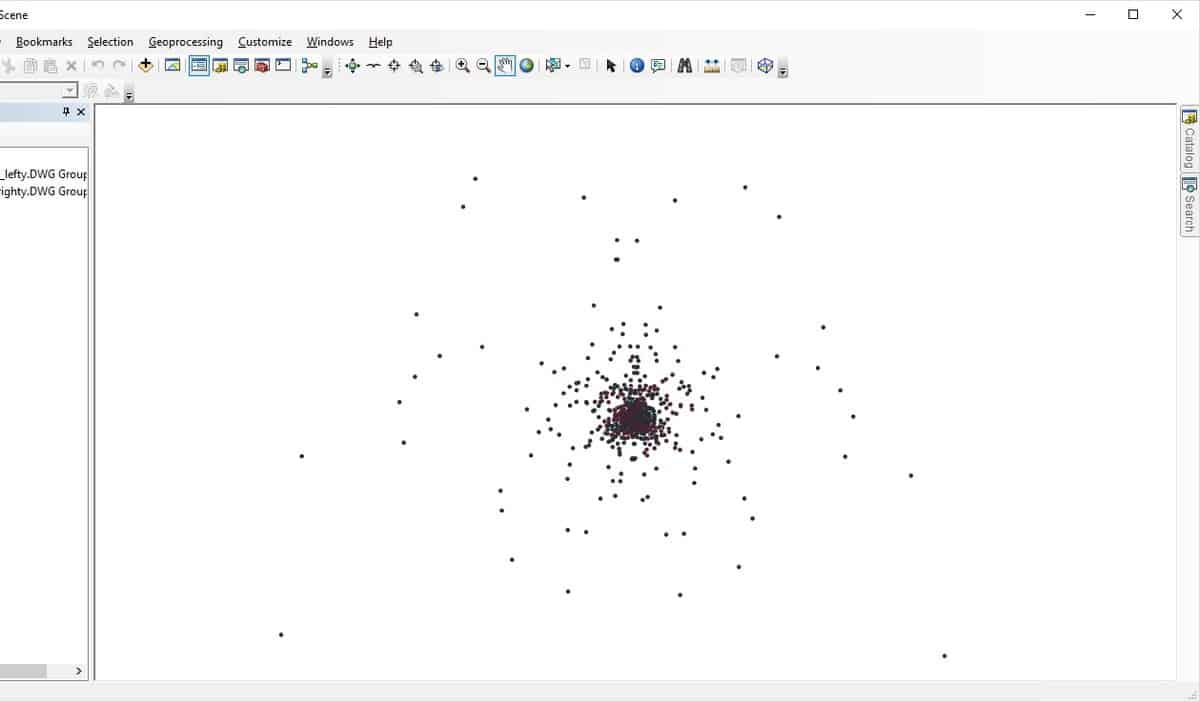
Hannah and I worked together to export raw data from Audition. This information shows up as – Frequency, Left, Right, Average. After we did that, we created a .CSV file. With Rob’s help, we mapped the data using ArcMap GIS software to create a .dwg file with 3 pieces of the data (X – Left, Y – Right, Z – Frequency). Looking at this image in 3-D orbit was fascinating! There is almost a tubular inner structure, with wave-like outside variations. The X, Y view it looks like a flashlight. This felt apropos.
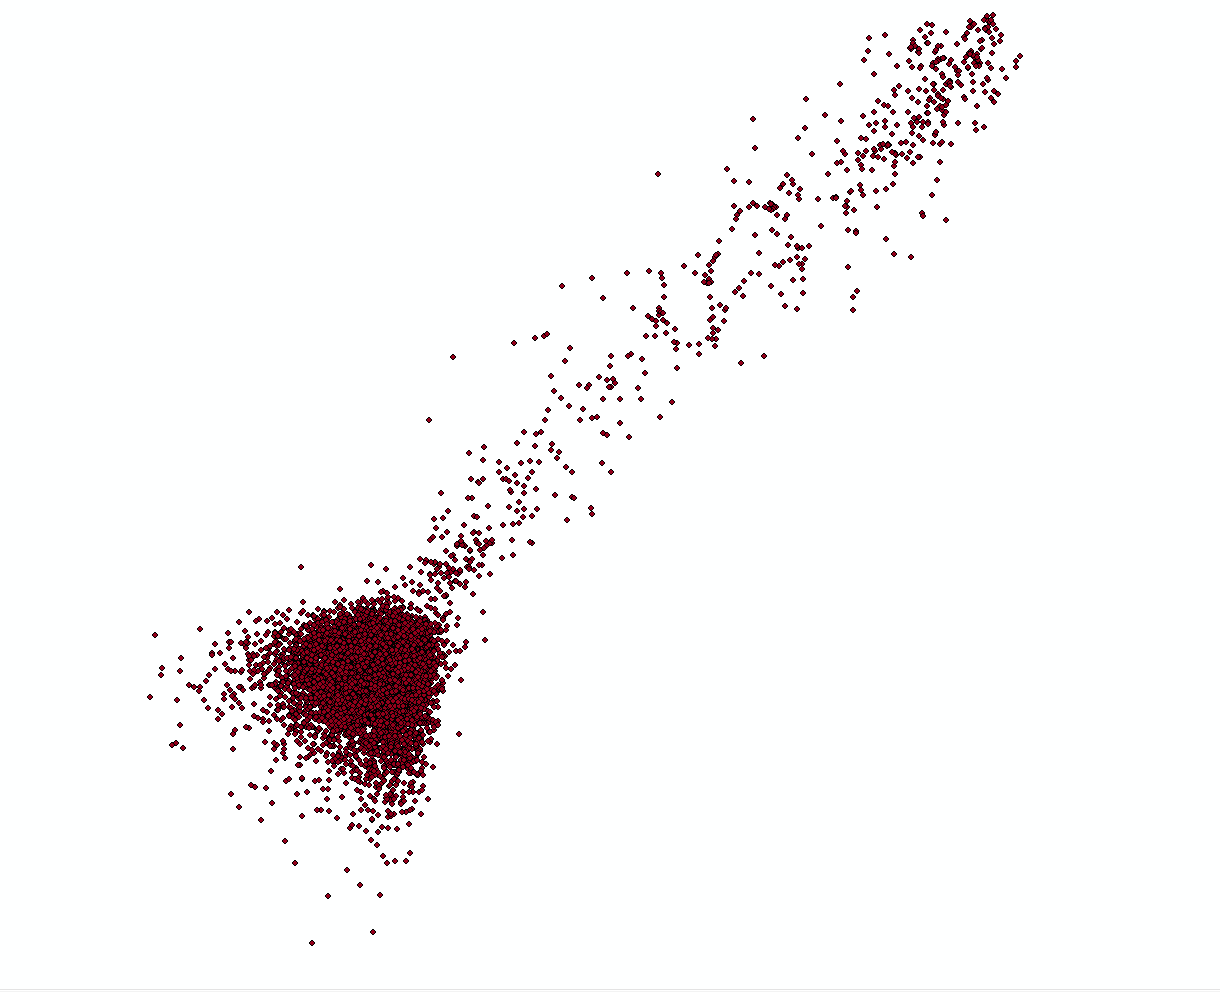
As mapped in GIS software
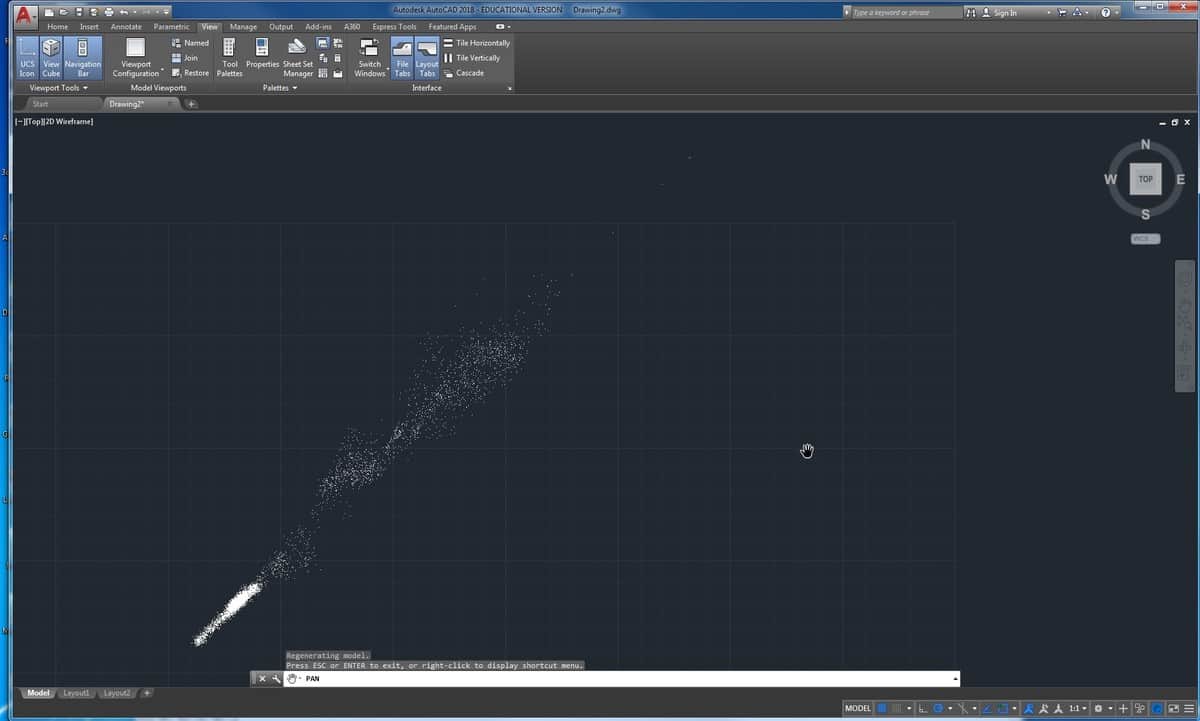
After we were able to map this first tiny sound clip, the goal was to try other unique clips and see how they looked using the same process. We were able to use AutoCAD alone to map the data using a MULTIPLE, POINT command. Oh my, I can’t thank Hannah enough for her patience and insight in this process! AutoCAD feels like Greek compared to Photoshop and other digital design programs I am more familiar with. After some trial and error, it felt really good to develop some fluency with the AutoCAD software and begin to understand how it works and how to navigate within the program.
After organizing a group of very distinct clips of individual birds from the Kettleson Hogsback recording, the excitement of the week came when another sound clip mapped totally differently! Here is how a few of them look:
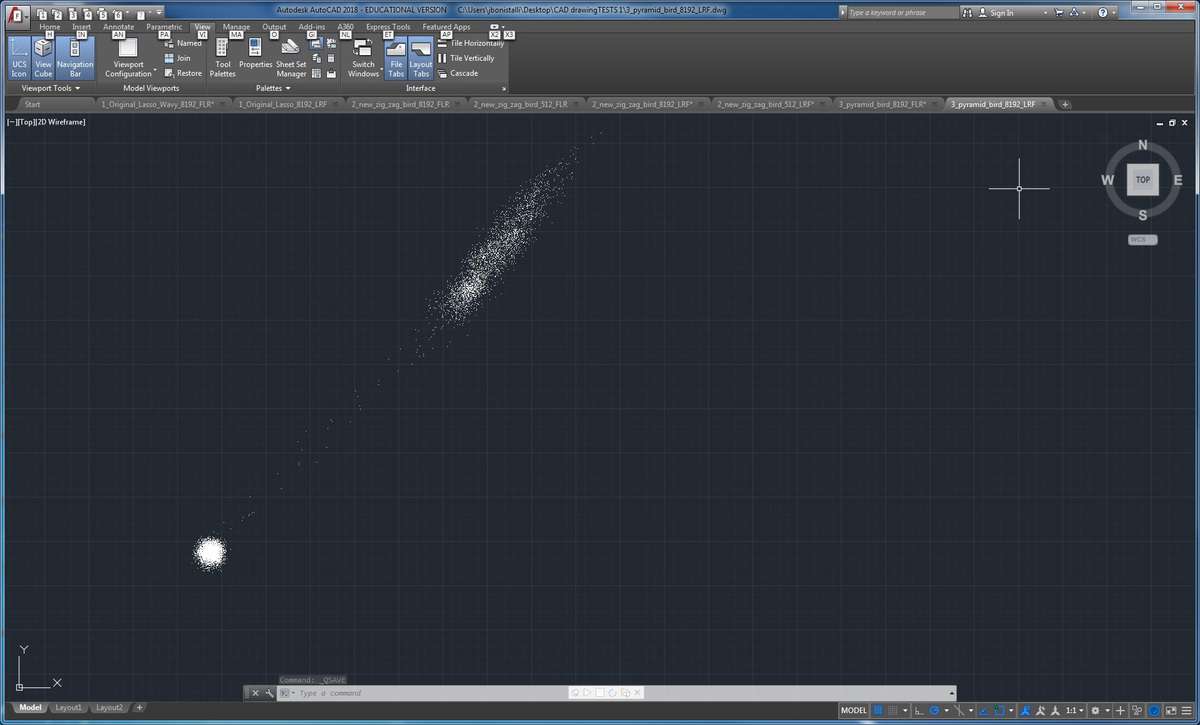
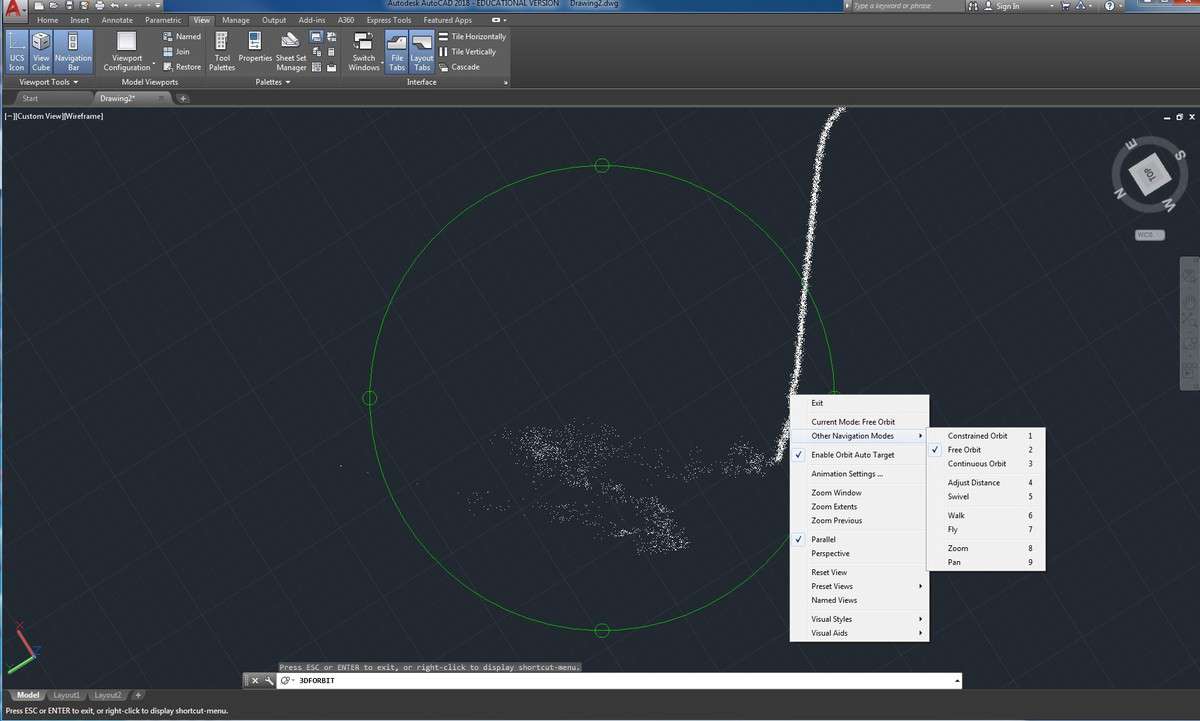
Keeping in mind these are 3-D visualizations, within the software, you can fly around and within the designs, exploring them from multiple vantage points.
Data is a slippery thing. I say that because from this one sound clip (a singular momentary experience; a fingerprint if you will), there are many pieces of data to export and many ways to organize that information. So far, it seems the variables one could work with from these audio programs are: frequency (Hz), left, right, average, Level (dB), sample number and time (seconds) . FFT size (the temporal or frequency resolution, precision in representation of the signal or spectra), having 540 points mapped vs. 9138 points mapped, also changes things dramatically.

This design is mapped with an FFT of 512 rather than 9138
Based on which data is exported and how it is organized, the visualization can REALLY change. Is one true and another not? I guess you could call data and its organization/curation an integral part of the design process, a filter of sorts. The software is a filter as well. For example, the way we were able to see and export the clips in Audition (Adobe software) vs. Audacity (open source digital audio software) differed a great deal. I hope to spend some time trying to export data from Audacity as well and playing with some of these variations and permutations.
Another thought on visualization would be to take this sound data and run it through a fractal algorithm to create a fractal or attractor. It seems there might be a bit of coding involved in this process, which is not my forte, but could be interesting to see if there are variations and what they look like. Similarly, there is something lovely about looking at these constellation-like structures as they are, without any formula modulating them.
At one point, we mirrored the data. Hannah, Rob and I joked that maybe there are secret bird messages (or hieroglyphics) in these interpretations. We, over here, are just humans searching to unearth an alchemy in the code.
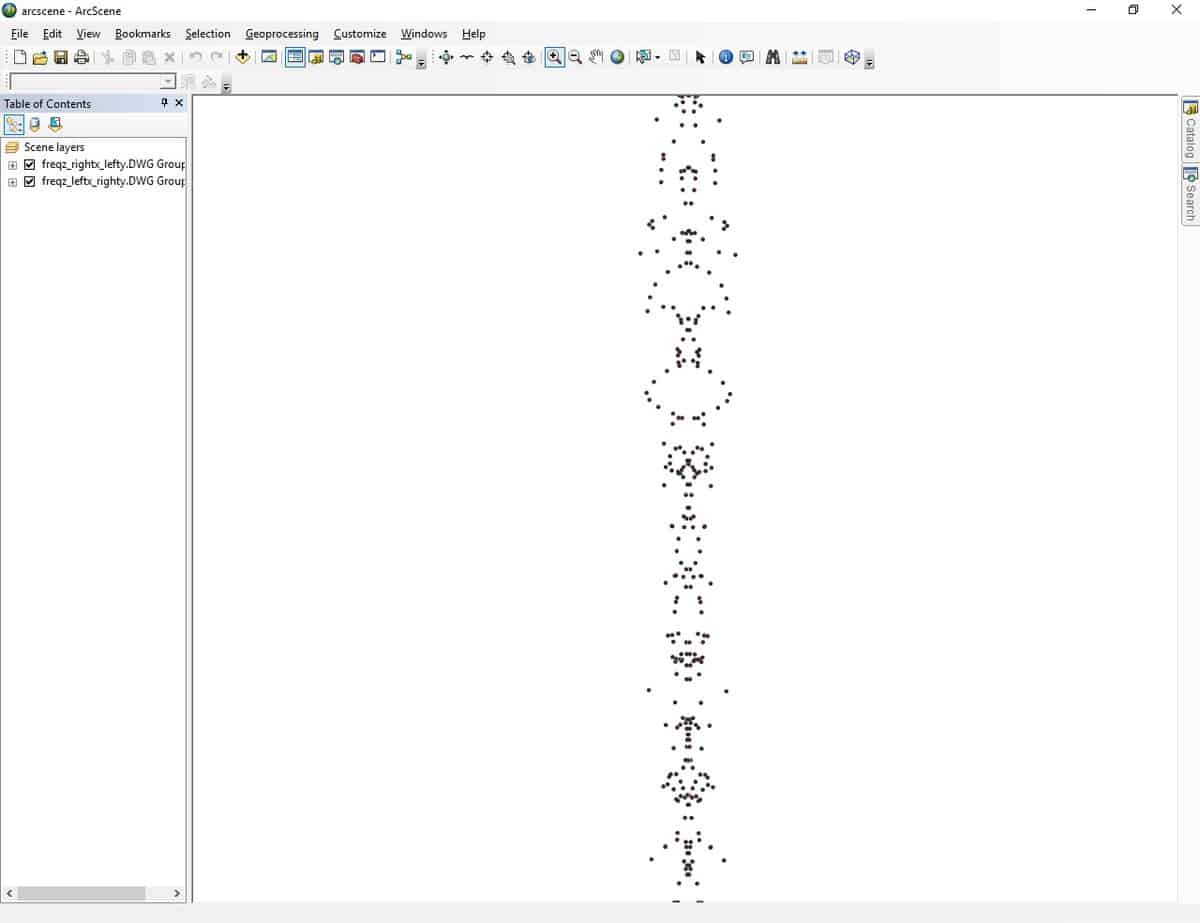
Mirrored data in ArcScene
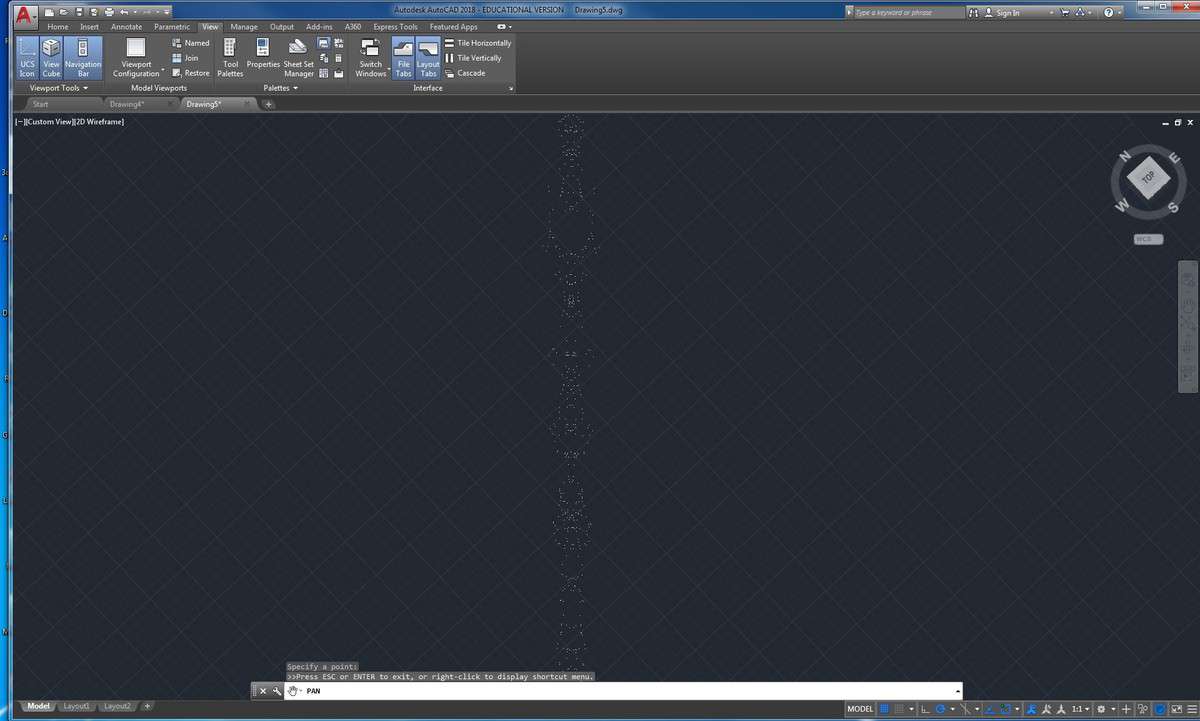
Mirrored data in AutoCAD
After continuing this mapping process, I plan to see what I have and how I might like to compose or arrange the material. After, I hope to translate these CAD designs into the specific program software for digital embroidery – Tajima Pulse, or another, depending on the machine. I hope to use this CAD work to map the design on paper with the CNC laser as well. In this process, I will think towards installation and how there might be a larger piece that could stem from this research and discovery.
Many thanks to Alex Braidwood, Dan Miller, Laurie Neuerberg, Hannah Scates Kettler, Sara Scheib and Rob Shepard for their support and input on this project so far. Enormous thanks to everyone at the digital studio for this fellowship experience, their time and assistance.
– Jenna Bonistalli