This semester I’m entering a new phase of my Digital Humanities scholarship. My project is simultaneously the capstone to my Public Digital Humanities Certificate and the very first project for my Informatics Certificate, in the form of the final project for my Geographic Databases class.
It seems appropriate that the project should be two things at once, as I began it in my first semester as a DH scholar in a class on Ancient Art. I began by mapping three different spatializations of the Christian Holy Land—two 7th-8th century mosaics and one 4th century book by a nun named Egeria outlining her Holy Land pilgrimage. By layering the locations referenced by all three sources in a digital map, I had expected to find some kind of pattern that reflected common locations and themes in Palestine, Transjordan, and Egypt that spoke to what early Christians thought the “Holy Land” was. Instead, my first map (created with the help of former Studio GIS specialist Rob Shepherd) looked like I had thrown confetti at it.
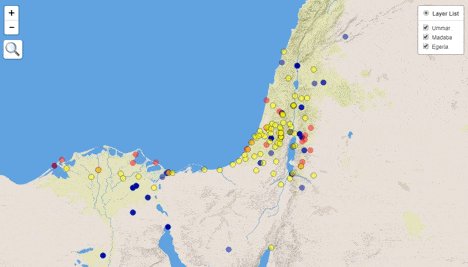
It was disappointing that I didn’t find the patterns I hoped to, but the “failure” of that first project piqued my curiosity further—What did early Christians think the Holy Land was, then? Where did it start and end? What towns, monasteries, and natural features characterized it, and how did ancient Christians know that?
So I applied to the Studio’s Summer Fellowship this year in order to expand my map and define those patterns. I spent the summer accumulating much more data and adding it to the map, and ended up proving Einstein’s definition of insanity.
So much more confetti. So much.
However, over the course of the summer as I plied my map with more and more datasets—pilgrimage itineraries, literary references, ancient road networks, archaeological remains, Roman temples, bishops’ seats, way stations, caravan roads, population and climate data, etc. etc. etc.—I realized the problem wasn’t the amount of data that I did or didn’t have, it was the variety of data types. How do I make the archaeological record speak to ancient artistic representations of the Holy Land? How do pilgrimage itineraries speak to population growth? I had to find better ways to analyze my data than merely color-coding confetti.
Luckily, the GIS program I’m using, ArcGIS, is very powerful and has many different analytical tools, but they are dependent upon some knowledge of geography, statistics, and the computer language Python. And I don’t know any of those things.
Also, it doesn’t end with this project. There are many other digital tools I want to use in my scholarship—text analysis, web design, and database management—and I don’t want to be dependent upon computer scientists to do analytical work for me. I want to engage my projects on a deeper level and mine the limits of what they can do. So this year I’m starting an Informatics Certificate that will teach me all of that and more. My first objective is to take the data I’ve amassed so far and turn it into an organized geographic database, with clear, searchable relations between the locations’ many attributes. It’s ironic to me that for my capstone I’m still struggling to start my first project.
-Andrea Scardina