The first two to three weeks of the Summer Fellowship were a flurry of data mining and expanding my digital map, but the last three have been a slow crawl through scholarship on Christian pilgrimage in the Holy Land, data cleaning, and endless online tutorials teaching me how to use ArcMap’s toolbox to analyze what I have mapped. What is clear to me now is that in order to better analyze my map, I need to take my dozens of datasets on specific archaeological remains, cities, literary references, and environmental features and condense them into 5-10 topical datasets that can be analyzed together. This process will take months, no doubt, but it took eight weeks to figure out how to organize my map in order to get the results I want.
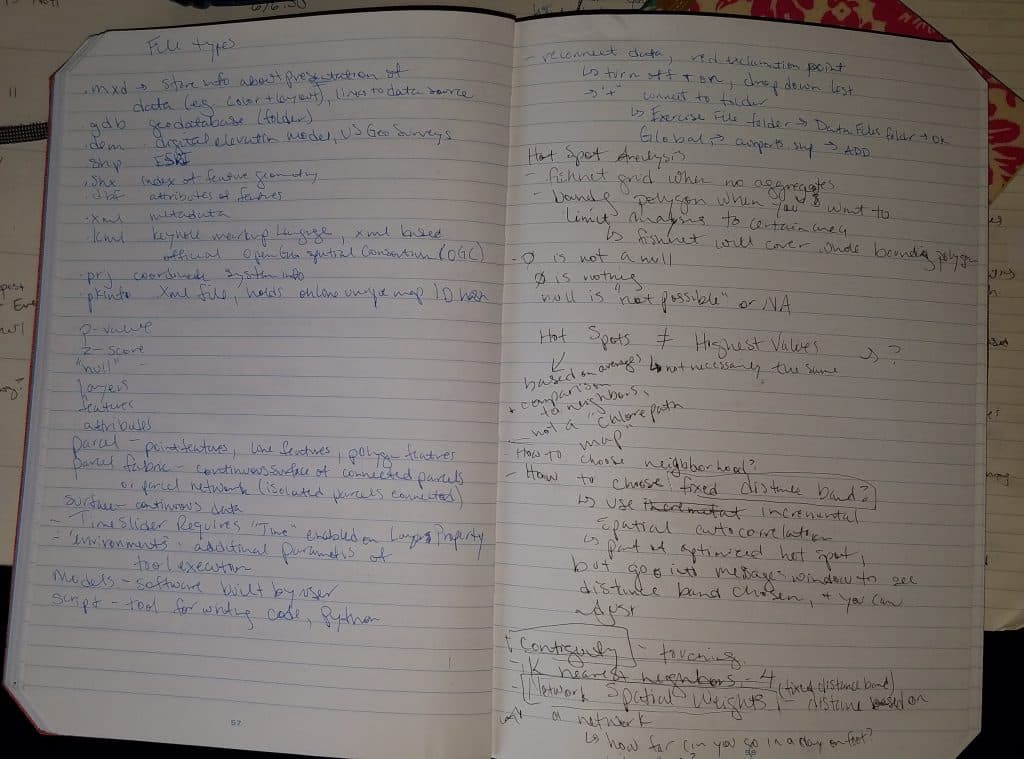
Working with ArcMap I have had to learn a number of computer and statistical skills that I never had to before. As I go through the endless online tutorials, I keep coming against terms that are utterly strange to me, like p-value, z-score, and choropleth. Each time I come across a new term, I google it and make another entry in my notebook under the growing heading “GIS vocab list.” Another section of the notebook has a long list of questions to bring to our GIS experts, who have been so patient and helpful throughout the summer. This part of the process has been intimidating, because humanists tend to avoid computer science and statistics. I know there is no such thing as “right-brained” and “left-brained” people, and yet I realize that I have always treated these kinds of skills as outside my “wheelhouse.”

Analyzing my data this summer has shown me that in fact these kinds of skills are not as frightening as they seem. The many new terms express analytical concepts I had encountered before but never put into words. I think that’s the trick to Digital Humanities—realizing that these tools are not foreign to us as Humanists, they simply use different language (a z-score expresses how one piece of data compares to others in its set, a p-value expresses the likelihood that statistical results are random and not meaningful, and a choropleth map is just a map that uses color or symbols to express values within different areas.)
Besides a greater knowledge of my field and GIS, the experience of immersing myself in DH work has shown me the value of leaning into unfamiliar studies. Learning a new DH skill can take ten minutes or ten days, but none of them are inaccessible. Plus every new skill I learn is a line on my CV that will someday help me find a job. As another Digital Humanist often tells me, we are learning DH because, in ten years, what we think of as “Digital Humanities” is just going to be called “Humanities.”
In the video below, I reflect on the future of this project and myself as a Digital Humanist.
