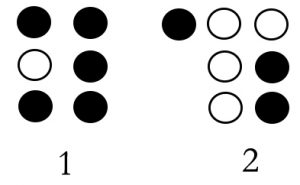
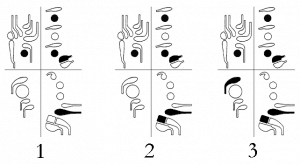
At this stage of the research, I selected 4 recorded audio examples all performed in one mode (3 pre-recorded and my own recording); first, in order to measure the frequencies and then, to look at the potential deferences between them. Our performed sample is the third measure of the previous report (D, raised E-flat, F, G)
To make the sound files similar to one another, I needed to cut the portions of the sound files from the original recordings in order to have a scale-like order of the pitches. That has been done in Audacity. Also, in some cases, I needed to change the tempo.
One of the issues that I came across was the different tunings of these recordings. In other words, the starting pitch (and as a result of that, the following pitches) are different than one another in these recordings. Although Iranian instruments have been tuned in C when they are supposed to be played for example in an orchestra or with western classical instruments, it is likely to find many recordings that are not tuned in C, especially solo recordings. Two reasons could be considered in this regard: first, the soloist is not meant to play with another musician and second, musicians might retune their instruments rather than modulating their mode because of the acoustic characters of their instruments.
To compare the sound files more accurately and also, show the results clearer, I decided to select my own sound file (which is tuned in C) as the default recording. Then, I pitch-shifted the other recordings in order to have all of my recordings in the same tuning. Therefore, I had to measure the frequency of the first pitch (D in this case) and set the rest to that frequency. This way, we would have 4 recorded samples which are in the same mode with the same starting pitch, as follows:
1st audio sample (Ramin Roshandel)
Audio Player2nd audio sample (Ahmad Ebadi)
Audio Player3rd audio sample (Mohammad Reza Lotfi)
Audio Player4th audio sample (Jalil Shahnaz)
Audio Player
Having these, now we are able to analyze the frequency (Hz) of the pitches by getting their plot spectrograms:
Ramin Roshandel: 296-321-351-396
Ahmad Ebadi: 296-323-356-398
Mohammad Reza Lotfi: 296-324-348-398
Jalil Shahnaz: 296-325-354-397
We can see that even though in all the examples, the first frequency is the same, the rest are different. This difference is even more for the third frequency because this degree of the mode in this specific mode (Abou-Atâ) is meant to be vibrated and this vibration decreases the accuracy of the pot spectrogram. In the first recording, we intentionally didn’t vibrate the string so that we can have an average frequency for that degree (351 Hz).
Then, we asked the musicians to perform different fingerings of the same four-note pattern and recorded them. Here are the results for the second note of this tetrachord and the frequency differences in cents:
Setar: +54 cents
Flute (one option, an octave higher): +38 cents
Audio PlayerClarinet (two options): +43, +49 cents
Audio Player Audio Player
Bassoon (three options, an octave lower)
+27, +27 , D natural +71 cents
Audio Player Audio Player Audio Player
My plan is following the same process for the other modes on a larger scale and having the closest, and the most accurate fingerings of these microtones and their ornamentations for the western classical instruments. Then, I will be able to use them in the piece that I’ve been working on.
Ramin Roshandel


