As the summer fellowship is wrapping up I am finding myself making a few small, but important, breakthroughs in my work. The most recent being the ability to utilize more of the functions of the ArcGIS platform. Specifically the select tool for highlighting information that is relevant for my work.
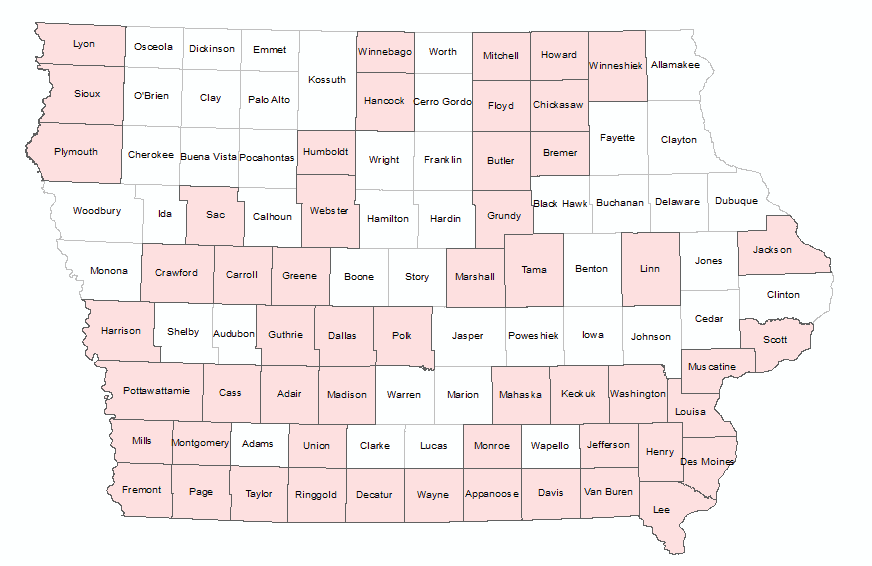
Figure 1. ArcGIS map of counties, in peach, that have had exploratory oil & gas wells drilled in them.
The map above gives the general sense of where exploration for hydrocarbons in the state of Iowa have taken place. For context, the easternmost counties are all on the border with Illinois, a state rich with oil and gas deposits that were developed primarily between the 1940s and the 1970s. The southwestern most counties fall into a geological feature known as the Forrest City Basin. Many successful wells have been developed in the parts of the basin located in northeastern Kansas. In addition there have been wells drilled along the midcontinental rift zone which bisects the state from its southwestern corner to its border with Minnesota around the area of Winnebago, Worth, and Mitchell county. This rift is a Precambrian geological feature created when the North American continent unsuccessfully tried to break apart. The possibility of hydrocarbon traps along the eastern and western sides of the rift account for the drilling through this area.
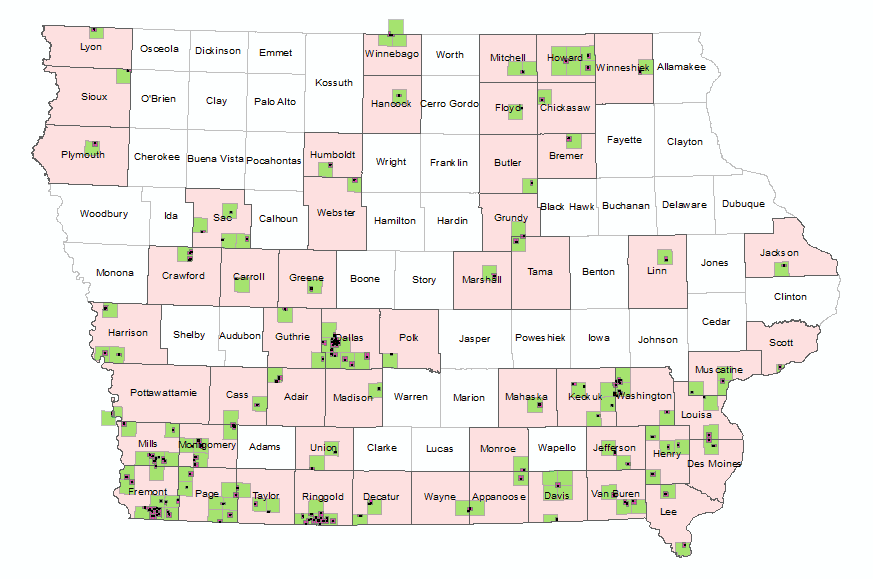
Figure 2 ArcGIS map with Counties, Townships, and Sections highlighted where O&G wells were drilled nearby.
This map gives a more focused idea of where the wells were drilled in each county. You can see the predominance of wells in the Forrest City Basin area, and the wells north of Polk county lining up along the eastern and western flanks of the midcontinent rift.
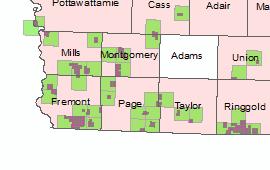
Figure 3 ArcGIS detail map of southwestern Iowa counties.
By zooming in to the southwestern corner of the state we can begin to see some the irregularities in the data. The map shows the counties in peach, townships in green, sections in pink, and the USGS well data as red with black borders (they look like martini olives!). The USGS well data do not align perfectly with the USGS’s Public Lands Survey System (PLSS), the layer I used to create the township and range data.
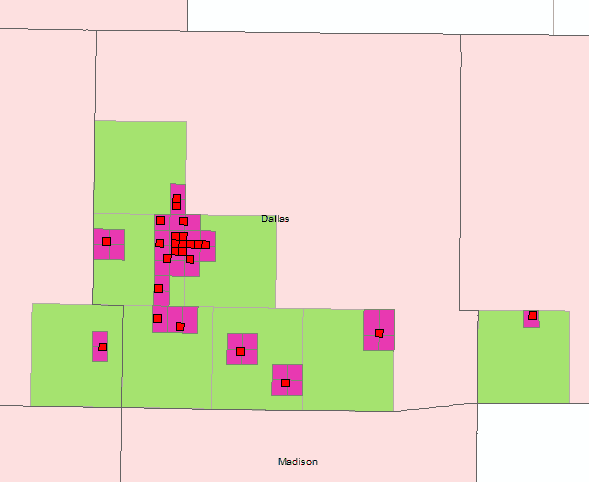
Figure 4 Dallas County, IA with townships, sections, and USGS well data highlighted.
This final map gives you a better sense of how vague the USGS well data are. You can see that within a given township several sections might be highlighted due to intersecting with one well data point. This is due to the decision by the USGS to represent the wells by quarter-mile squares that do not neatly plot into the existing PLSS grid. This is an intentional obfuscation on their part because the data are proprietary to S&P Global’s subsidiary RigData. However, by being able to use the select tool in ArcGIS I have been able to create lists of counties and townships that have had wells drilled in them, which allows me to cross-reference this data with what exists on the Iowa DNR data portal.
My next step will be to create a time-enabled layer that will show what decades the wells were drilled in, giving me yet another means by which to narrow my search. I hope to have this work done over the weekend and ready to show for our last class on Wednesday.
Best,
-J.W. Jepsen