I am contributing to an already existing project. Check out the current WOAH site.
In short, the goal of this project is to promote the awareness and visibility of non-male scholars who study the ancient world. Dr. Sarah E. Bond (Iowa, Classics) started WOAH to combat the plainly false notion that, “there aren’t any women who work on _________.” She does a much better job than I could describing the beginning and necessity of WOAH.
My efforts this summer are aimed at producing a polished interactive maps and visualizations to both easily find non-male scholars and explore the growing WOAH database in terms of research questions about gender equality, the composition of ancient history as a field, and network-map visualization theory.
I am enjoying my journey through learning what scholarship as building/making means thanks to the incredible resources (financial, yes – but more importantly, the time, expertise, and support of the Studio staff and scholars). While I expect the traditional avenues of scholarly argument, article, book, etc. will live longer than I will, it seems to me that we live in a time when researching and presenting arguments through websites and online tools is becoming increasingly attractive.
Despite coming to Iowa with no programming experience and a background in history and literature, I have learned how to build interactive visualizations. Check out some of my early steps [Many thanks to Dr. Paul Dilley (Iowa, Ancient Mediterranean Religions and Classics), Dr. Matthew Hannah (Purdue, Humanities, Social Sciences, Education, & Business), and Dr. Caglar Koylu (Iowa, Geographical and Sustainability Sciences) for their guidance and instruction]:
First WOAH Network Visualization (12-12-17)
Greek Drama Stylometrics (4-25-18)
WOAH Map and Network hybrid (5-8-18)
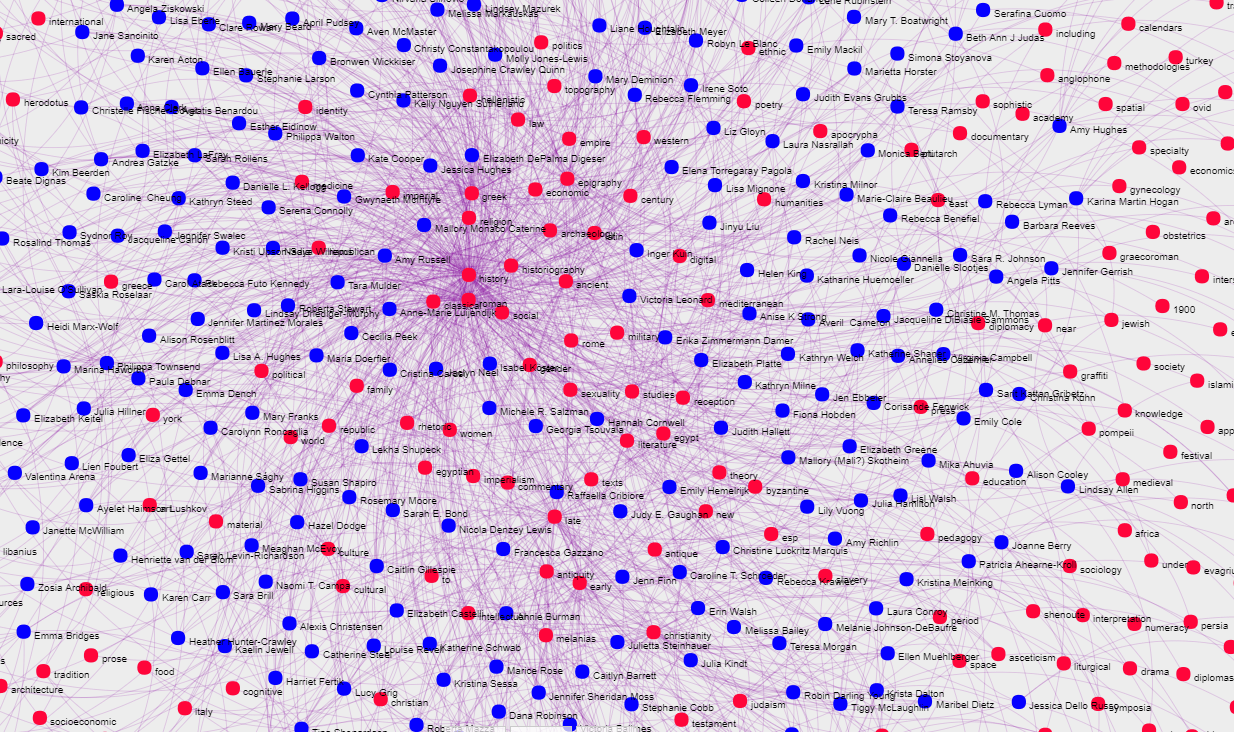
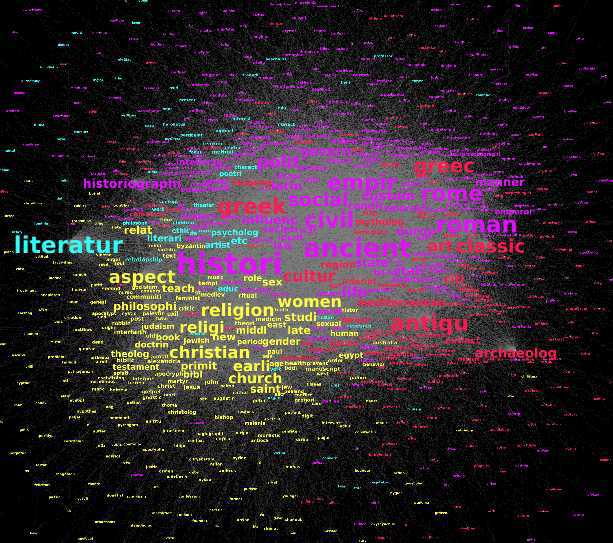
None of those efforts can stand by themselves. What they are might satisfy as ‘proof of concept’ or technical exercises. Fun to play with, but they require a lot of context to try and understand. I am intimidated by task of producing a tool that leverages the technology to make coherent arguments. After a week of data cleaning and updating, I felt a bit lost in data that I was working with. A network graph of ~2700 research interest terms with over 160,000 links is simply too busy:
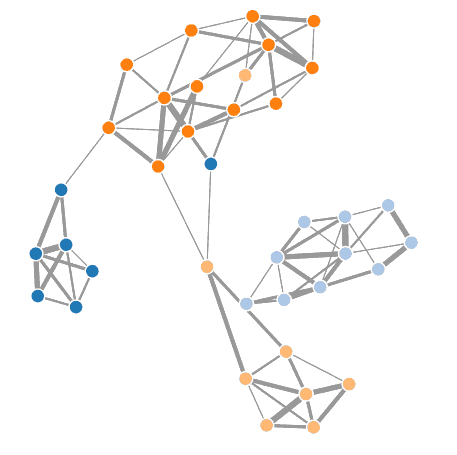
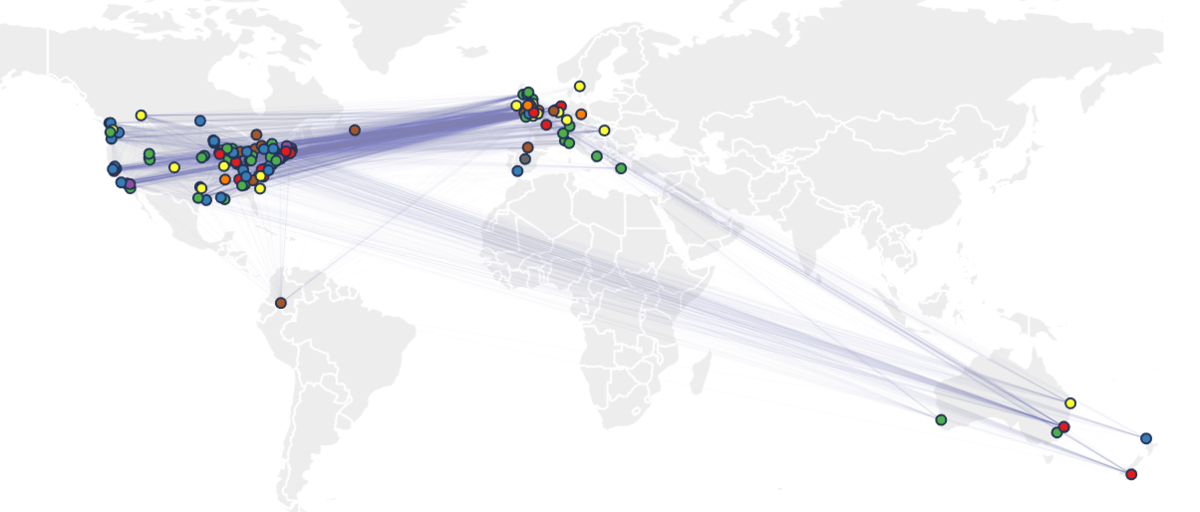
So for week 2, I focused on grounding the categories with a map. Very much still under development (inspired by and adapted from Bård Romstad’s traffic accident map), I used Gephi’s modularity plugin to create groups of scholars, who were organized by their entries for “Research Interests” and subject terms collected from their Worldcat Identities page. I certainly could have decided on my own group of categories and assigned scholars as I see fit. However, my hope is that using text mining tools and algorithms will limit the extent that my own personal biases weigh on the organization of the non-male scholars. A technical explanation for the grouping process will be a necessary component for the final presentation of the following visualization:
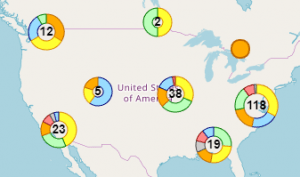
WOAH Clustering Scholar Interest Map (6-26-18)
My next steps involve more data collection and grouping. Ideally, different facets, such as PhD institution, year, current position would be filterable through the map interface itself.
Thanks are due to Nikki White (Iowa, Digital Studio) for guiding me through networky woods and reminding me about some key points to consider. In terms of developing arguments, from either this map or subsequent visualizations, the fact that the database is user submitted and incomplete must be remembered. The current database is predominately English speaking but this in no way means that ancient history is only studied by English speakers. A possible benefit to showing prototypes is to inspire people who see gaps in the database to submit new entries.
More to come…
I welcome suggestions,
Ed Keogh
edward-keogh@uiowa.edu
