For someone who did not do well in my college statistics course (read: I did not do AT ALL well….), The Tao of Statistics: A Path to Understanding (With No Math) sounded intriguing. The intriguing part, I’ll admit, is the “No Math” part of the subtitle…
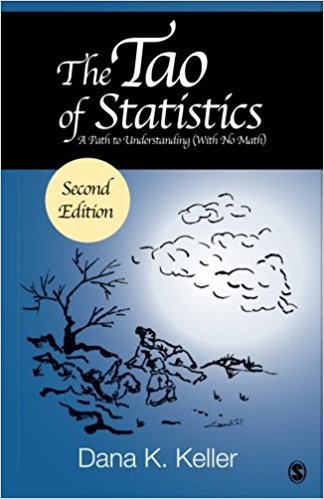
The author, Dana K. Keller, PhD, has a unique and balanced approach to statistics and data. He has explored Taoism and Eastern philosophies for nearly 5 decades – including teaching in China and Tibet. His PhD is in measurement, statistics, and program evaluation. The goal of this book? “To introduce readers to the commonly encountered terms and techniques in statistics through verse, graphical illustrations, and accompanying text. No equations are used. [emphasis mine!]. The result is an understanding of each concept that is created without having to do math.” (again, the emphasis is mine!). In the introduction we are told, “you do not need to know how to calculate statistics to understand what they are telling you.” This sounded promising to me!
I think we all know how important statistics are. They are, after all, constantly present in our daily lives. We use statistics all the time – often without thinking about it. Listen to the evening news and pay attention to how often statistics are used to illustrate and back up those news stories. We look at our typical gas mileage, current road and weather conditions, and use that information to to figure out how far we can make it before we need to stop to refuel on our way to that vacation destination…

From “The Tao of Statistics.” Illustrations by Helen Cardiff.
So, where do we start? On page 1. “The world of statistics starts with a question, not with data.” Statistics are important when they are about things that we, as humans, consider important. And from that simple beginning, Keller carefully, and thoroughly, explains what statistical terms mean. Each term – such as reliability, central tendencies, standard deviations and variance, probability, etc. – has its own brief chapter. Chapters are generally one page long, but not over 3 pages and only deal with that particular facet of statistics.
If statistics terms had been explained to me like this I might have done much better in my college course!
The book follows two professionals with very different careers and their concerns with statistics and how they are used. One is a high school principal who uses statistics to discern differences in quality and other characteristics of classes taught in his high school. The other professional is a director of public health. She has questions about how well the residents of her state are meeting national guidelines for public health issues. Using these professionals as examples helps put the differing uses of statistics into real-life situations.
So, why do (most) students dislike statistics so much? In the chapter, “Averages – Central Tendencies,” Keller explains it this way, “Many students first come to dislike statistics when introduced to central tendencies. This is no surprise. The topic begins by making something complicated that should be simple: an average.” He then succinctly explains the average in one page, summed up with the saying:
Keller also provides vivid (understandable and memorable) examples of statistics terms. For example, when explaining the term “mean,” he states: “When one foot is in scalding water and the other in ice water, how consoling is it that, on average, the temperature is fairly comfortable? Think about interpretations of the mean.” Not sure about you, but that is a visualization that I probably won’t forget!
Want to understand the difference between consistency and reliability? The example of three archers and where their arrows land on the target explains them very well (chapter 17)! And once you’ve read that explanation, the saying at the beginning of that chapter should help you remember!
Keller also addresses the ethical use of statistics – the potential for stereotyping and dangers of “unreflectively” using statistics. Throughout the book he looks at the pitfalls of misinterpreting data, using data in the wrong ways and our own bias – whether conscious or unconscious.
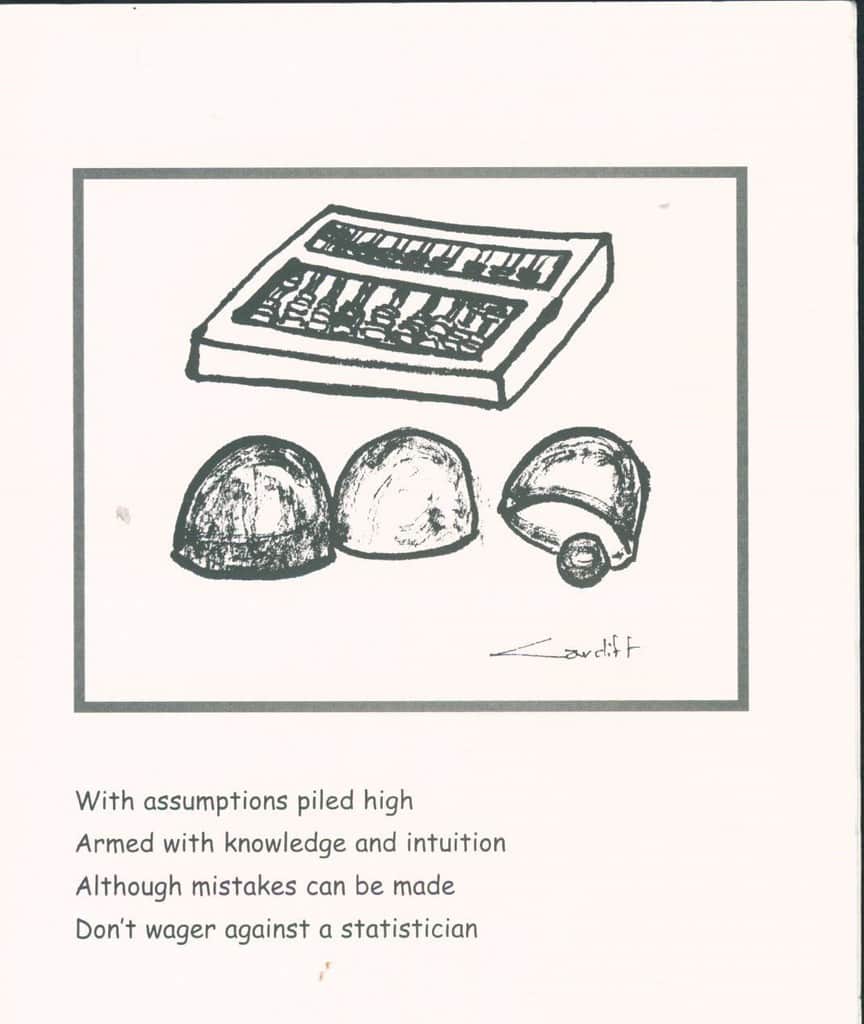
From “The Tao of Statistics.” Illustrations by Helen Cardiff.
For those of you who are now intrigued with the world of statistics and want to explore further – including the mathematical aspects – we have resources ranging from Introductory Statistics to statistics dealing with very specific areas (Statistical Thermodynamics of Semiconductor Alloys, for example!) to Statistics Done Wrong : the Woefully Complete Guide!
Keller suggests the best way to read this book is to, “Take your time. Breathe deeply and slowly. Relax. Let the world pass you by.” So, kick back, relax and experience The Tao of Statistics!
Resource:
Keller, Dana K. 2016. The tao of statistics : a path to understanding (with no math). Los Angeles : SAGE. Engineering Library QA276 .K253 2016
Other Resources:
Weiss, N.A. 2016. Introductory statistics. Boston : Pearson. Engineering Library QA276.12 .W45 2016
Elyukhin, Vyacheslav A. 2016. Statistical thermodynamics of semiconductor alloys. Amsterdam, Netherlands ; Oxford, UK ; Waltham, MA : Elsevier. Engineering Library TK7871.85 .E49 2016
Reinhart, Alex. 2015. Statistics done wrong : the woefully complete guide. San Francisco : No Starch Press. Engineering Library QA276 .R396 2015.